Learning Tableau 2019
eBook - ePub

Learning Tableau 2019

Tools for Business Intelligence, data prep, and visual analytics, 3rd Edition

Joshua N. Milligan

Share book
  1. 504 pages
  2. English
  3. ePUB (mobile friendly)
  4. Available on iOS & Android
eBook - ePub

Learning Tableau 2019

Tools for Business Intelligence, data prep, and visual analytics, 3rd Edition

Joshua N. Milligan

Book details
Book preview
Table of contents
Citations

About This Book

Create powerful data visualizations and unlock intelligent business insights with Tableau

Key Features

  • Explore all the latest Tableau 2019 features and redefine business analytics for your organization
  • Create impressive data visualizations and interactive dashboards to get insights from your data
  • Learn effective data storytelling to transform how your business leverages data and makes decisions

Book Description

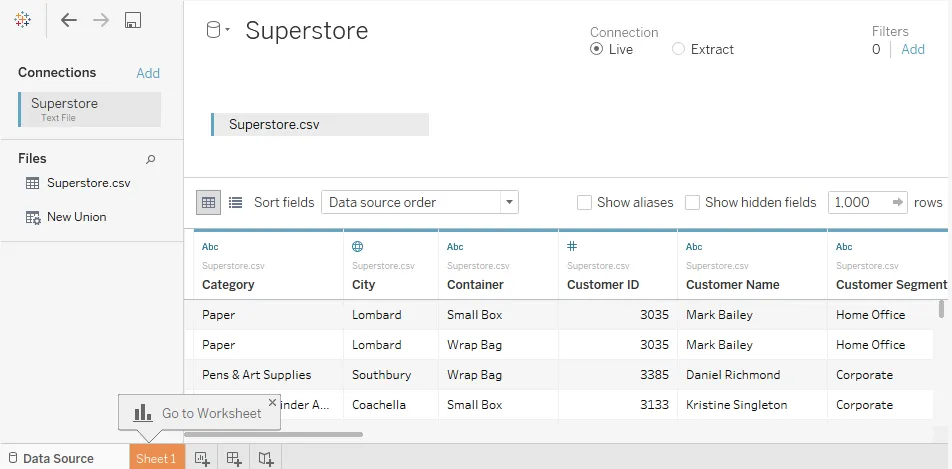
Tableau is the gold standard of business intelligence and visual analytics tools in every industry. It enables rapid data visualization and interpretation with charts, graphs, dashboards, and much more. Updated with the latest features of Tableau, this book takes you from the foundations of the Tableau 2019 paradigm through to advanced topics.

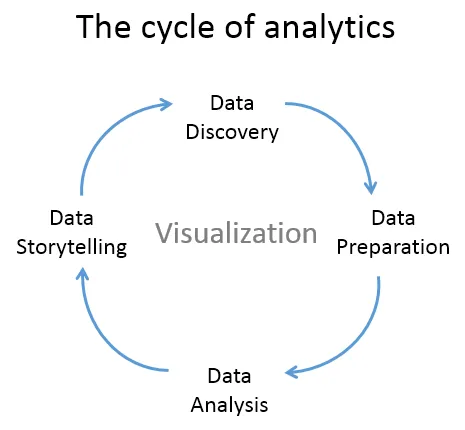
This third edition of the bestselling guide by Tableau Zen Master, Joshua Milligan, will help you come to grips with updated features, such as set actions and transparent views. Beginning with installation, you'll create your first visualizations with Tableau and then explore practical examples and advanced techniques. You'll create bar charts, tree maps, scatterplots, time series, and a variety of other visualizations. Next, you'll discover techniques to overcome challenges presented by data structure and quality and engage in effective data storytelling and decision making with business critical information. Finally, you'll be introduced to Tableau Prep, and learn how to use it to integrate and shape data for analysis.

By the end of this book, you will be equipped to leverage the powerful features of Tableau 2019 for decision making.

What you will learn

  • Develop stunning visualizations that explain complexity with clarity
  • Explore the exciting new features of Tableau Desktop and Tableau Prep
  • Connect to various data sources to bring all your data together
  • Uncover techniques to prep and structure your data for easy analysis
  • Create and use calculations to solve problems and enrich analytics
  • Master advanced topics such as sets, LOD calcs, and much more
  • Enable smart decisions with clustering, distribution, and forecasting
  • Share your data stories to build a culture of trust and action

Who this book is for

This Tableau book is for anyone who wants to understand data. If you're new to Tableau, don't worry. This book builds on the foundations to help you understand how Tableau really works and then builds on that knowledge with practical examples before moving on to advanced techniques. Working experience with databases will be useful but is not necessary to get the most out of this book.

Frequently asked questions

How do I cancel my subscription?
Simply head over to the account section in settings and click on ā€œCancel Subscriptionā€ - itā€™s as simple as that. After you cancel, your membership will stay active for the remainder of the time youā€™ve paid for. Learn more here.
Can/how do I download books?
At the moment all of our mobile-responsive ePub books are available to download via the app. Most of our PDFs are also available to download and we're working on making the final remaining ones downloadable now. Learn more here.
What is the difference between the pricing plans?
Both plans give you full access to the library and all of Perlegoā€™s features. The only differences are the price and subscription period: With the annual plan youā€™ll save around 30% compared to 12 months on the monthly plan.
What is Perlego?
We are an online textbook subscription service, where you can get access to an entire online library for less than the price of a single book per month. With over 1 million books across 1000+ topics, weā€™ve got you covered! Learn more here.
Do you support text-to-speech?
Look out for the read-aloud symbol on your next book to see if you can listen to it. The read-aloud tool reads text aloud for you, highlighting the text as it is being read. You can pause it, speed it up and slow it down. Learn more here.
Is Learning Tableau 2019 an online PDF/ePUB?
Yes, you can access Learning Tableau 2019 by Joshua N. Milligan in PDF and/or ePUB format, as well as other popular books in Business & Business Intelligence. We have over one million books available in our catalogue for you to explore.

Information

Year
2019
ISBN
9781788838740
Edition
3

Section 1: Tableau Foundations

This section lays the foundations for data visualization in Tableau. It provides an overview of the interface and terminology, explains data connections, and covers a wide variety of visualization types.
This section consists of the following chapters:
  • Chapter 1, Taking Off with Tableau
  • Chapter 2, Working with Data in Tableau
  • Chapter 3, Venturing on to Advanced Visualizations

Taking Off with Tableau

When you first encounter a dataset, often the first thing you see is the raw dataā€”numbers, dates, text, field names, and data types. Almost certainly, there are insights and stories that need to be uncovered and told, decisions to make, and actions to take. But how do you find the significance? How do you uncover the meaning and tell the stories that are hidden in the data?
Tableau is an amazing platform for seeing, understanding, and making key decisions based on your data! With it, you will be able to achieve incredible data discovery, data analysis, and data storytelling. You'll accomplish these tasks and goals visually using an interface that is designed for a natural and seamless flow of thought and work.
To leverage the power of Tableau, you don't need to write complex scripts or queries. Instead, you will be interacting with your data in a visual environment where everything that you drag and drop will be translated into the necessary queries for you and then displayed visually. You'll be working in real time, so you will see results immediately, get answers as quickly as you can ask questions, and be able to iterate through potentially dozens of ways to visualize the data to find a key insight or tell a piece of the story.
This chapter introduces the foundational principles of Tableau. We'll go through a series of examples that will introduce the basics of connecting to data, exploring and analyzing the data visually, and finally putting it all together in a fully interactive dashboard. These concepts will be developed far more extensively in subsequent chapters. But don't skip this chapter, as it introduces key terminology and key concepts, including the following:
  • The cycle of analytics
  • Connecting to data
  • Foundations for building visualizations
  • Creating bar charts
  • Creating line charts
  • Creating geographic visualizations
  • Using Show Me
  • Bringing everything together via a dashboard

The cycle of analytics

As someone who works with and seeks to understand data, you will find yourself working within the cycle of analytics. This cycle might be illustrated as follows:
Tableau allows you to jump to any step of the cycle, move freely between steps, and iterate through the cycle very rapidly. With Tableau, you have the ability to do the following:
  • Data discovery: You can very easily explore a dataset using Tableau and begin to understand what data you have visually.
  • Data preparation: Tableau allows you to connect to data from many different sources and, if necessary, create a structure that works best for your analysis. Most of the time, this is as easy as pointing Tableau to a database or opening a file, but Tableau gives you the tools to bring together even complex and messy data from multiple sources.
  • Data analysis: Tableau makes it easy to visualize the data, so you can see and understand trends, outliers, and relationships. In addition to this, Tableau has an ever-growing set of analytical functions that allow you dive deep into understanding complex relationships, patterns, and correlations in the data.
  • Data storytelling: Tableau allows you to build fully interactive dashboards and stories with your visualizations and insights so that you can share the data story with others.
All of this is done visually. Data visualization is the heart of Tableau. You can iterate through countless ways of visualizing the data to ask and answer questions, raise new questions, and gain new insights. And you'll accomplish this as a flow of thought.

Connecting to data

Tableau connects to data stored in a wide variety of files and databases. This includes flat files, such as Excel documents, spatial files, and text files; relational databases, such as SQL Server and Oracle; cloud-based data sources, such as Google Analytics and Amazon Redshift; and OLAP data sources, such as Microsoft Analysis Services. With very few exceptions, the process of analysis and creating visualizations will be the same, no matter what data source you use.
We'll cover details of connecting to different types of data sources in Chapter 2, Working with Data in Tableau. And we'll cover data spanning a wide variety of industries in other chapters. For now, we'll connect to a text file, specifically, a comma-separated values file (.csv). The data is a variation of the sample that ships with Tableau: Superstore, a fictional retail chain that sells various products to customers across the United States. Please use the supplied data file instead of the Tableau sample data, as the variations will lead to differences in visualizations.
The Chapter 1 workbooks, included with the code files bundle, already have connections to the file, but for this example, we'll walk through the steps of creating a connection in a new workbook:
  1. Open Tableau. You should see the home screen with a list of connection options on the left and, if applicable, thumbnail previews of recently edited workbooks in the center, along with sample workbooks at the bottom.
  2. Under Connect and To a File, click Text File.
  1. In the Open dialogue box, navigate to the \Learning Tableau\Chapter 01 directory and select the Superstore.csv file.
  2. You will now see the data connection screen, which allows you to visually create connections to data sources. We'll examine the features of this screen in detail in the Connecting to data section of Chapter 2, Working with Data in Tableau. For now, Tableau has already added and given a preview of the file for the connection:
For this connection, no other configuration is required, so simply click on the Sheet 1 tab at the bottom to start visualizing the data! You should now see the main work area within Tableau, which looks like this:
We'll refer to elements of the interface throughout the book using specific terminology, so take a moment to familiarize yourself with the terms used for various components numbered in the preceding screenshot:
  1. The Menu contains various menu items for performing a wide range of functions.
  2. The Toolbar allows for common functions such as undo, redo, save, add a data source, and so on.
  3. The Side Bar contains tabs for Data and Analytics. When the Data tab is active, we'll refer to the side bar as the data pane. When the Analytics tab is active, we'll refer to the side bar as the analytics pane. We'll go into detail later in this chapter, but for now, note that the data pane shows the data sour...

Table of contents