eBook - ePub
Environmental Economics, Experimental Methods
- 512 pages
- English
- ePUB (mobile friendly)
- Available on iOS & Android
eBook - ePub
Environmental Economics, Experimental Methods
About this book
The experimental method is one commonly applied to issues of environmental economics; this book brings together 63 leading researchers in the area and their latest work exploring the behavioural underpinnings of experimental environmental economics. The essays in this volume will be illuminating for both researchers and practitioners, specific
Trusted by 375,005 students
Access to over 1.5 million titles for a fair monthly price.
Study more efficiently using our study tools.
Information
Subtopic
Business GeneralIndex
BusinessPart I
Tradable permit markets
1 Baseline-and-credit emission permit trading
Experimental evidence under variable output capacity
Neil J. Buckley, Stuart Mestelman, and R. Andrew Muller
Introduction
Emission trading is now well established as a method for regulating emissions of uniformly mixed pollutants. The classic analysis assumes that the regulatory authority sets an aggregate cap on emissions from a set of sources and then divides the cap into a number of tradable permits (frequently called allowances), each of which authorizes the discharge of a unit quantity of emissions. Although the allowances could be sold at auction to raise revenue, the most frequently discussed plans assume that the permits will be distributed to the regulated firms on some ad hoc basis. Firms then trade the allowances, establishing a market price. In equilibrium, individual firms choose emissions such that the marginal cost of abating pollution equals the allowance price, thereby minimizing the cost of maintaining the mandated level of emissions. They redeem allowances equal to the emissions discharged, selling or banking the remainder. If emissions exceed the initial distribution of allowances the firm must purchase allowances to cover the excess. Such plans are generally known as cap-and-trade plans. A good example is the US EPA’s sulfur dioxide auction.
Many field implementations of emissions trading take a different approach. An example is the clean development mechanism proposed under the Kyoto Protocol. In these baseline-and-credit plans there are no explicit caps on aggregate emissions. Instead, each firm has the right to emit a certain baseline level of emissions. This baseline may be derived from historical emissions or from a performance standard that specifies the permitted ratio of emissions to output. Firms create emission reduction credits by emitting fewer than their baseline emissions. These credits may be banked or sold to firms who exceed their baselines. The effect is to limit aggregate emissions to an implicit cap equal to the sum of the individual baselines. Typical baseline-and-credit plans also differ from classic cap-and-trade in a number of institutional details. For example, credits are often computed on a project-by-project basis rather than on the basis of enterprise-wide emissions. They must be certified and registered before they can be traded and there are generally restrictions that credits cannot be registered until the emission reductions have actually occurred.
Baseline-and-credit plans are theoretically equivalent to a cap-and-trade plan if the cap implicit in the baseline-and-credit plan is fixed and numerically equal to the fixed cap in a cap-and-trade plan. In many cases, however, the baseline is computed by multiplying a measure of firm scale (energy input or product output) by a performance standard specifying a required ratio of emissions to input or output.1 In this case, the implicit cap on aggregate emissions varies with the level of aggregate output. Fischer (2001, 2003) refers to such plans as tradable performance standards.
The variable baseline in a baseline-and-credit plan introduces a critical difference in long-run performance compared to cap-and-trade with the same implied performance standard.2 Specifically, the variable baseline acts as a subsidy on output. Firms receiving this subsidy will tend to expand their capacity to produce output. This introduces two potential inefficiencies. First, if the performance standard remains the same in both plans, the baseline-and-credit plan will exhibit inefficiently high output, emissions and external costs. Second, if the performance standard under baseline-and-credit is tightened so as to meet the aggregate emissions specified under cap-and-trade, then industry costs will increase due to unnecessarily tight restrictions on emitting firms (Muller 1999; Dewees 2001; Fischer 2001, 2003). It should be noted that this reasoning presumes that firms are adjusting to pollution regulation on two margins: the emission intensity of output and the level of output itself. Moreover the reasoning is essentially long run in that output is changed by firms investing or divesting themselves of productive capacity and equilibrium is computed by imposing a zero-profit restriction on firms in the market.
Currently, at the international level there are more active baseline-and-credit greenhouse gas-trading plans than cap-and-trade greenhouse gas-trading plans (Hasselknippe 2003). However, the predictions on the relative performance of baseline-and-credit versus cap-and-trade have not been tested in the laboratory. Thus far, experiments have been fruitful in shaping cap-and-trade public policy (Cason 1995; Cason and Plott 1996), but as of yet no baseline-and-credit laboratory studies have been published. Laboratory implementation of baseline-and-credit trading would serve several goals: it would verify that market processes are sufficient to drive agents to competitive equilibrium, demonstrate the contrast between baseline-and-credit and cap-and-trade to policy makers, and possibly create a vehicle for training policy makers and practitioners in the nature of alternative emission trading plans.
We have undertaken a long-term research project to compare the properties of baseline-and-credit and cap-and-trade plans in the laboratory. In previous work (Buckley et al. 2006) we have developed a tractable model with constant returns to scale in production and multiple firm types. We have implemented a computerized laboratory environment with explicit capacity and emission intensity decision, fully specified markets for emission rights and output, and a complete accounting framework. We have demonstrated that predicted results hold in simulated markets with robot traders adjusting on both the output and emissions intensity margins. However, market instability occurs when capacity is freely adjustable, so we have implemented work with human subjects slowly, examining the emissions intensity margin and the output market margin one at a time.
Previous experiments involving human subjects have focused on the intensity decision. Buckley (2005) and Buckley et al. (2006) report on six sessions comparing baseline-and-credit with cap-and-trade when firm capacities are fixed and firm adjustment is limited to emission intensity. They sought to evaluate the prediction that the outcome of the two approaches would be the same when the output subsidy inherent in the baseline-and-credit plan could not possibly lead to productive expansion. Any deviation from parallel results would be then laid to the institutional differences between the two plans rather than the implied subsidy on output and emissions. Those studies confirm that the overall predictions on emissions hold. Efficiency in the market was improved, although only about one-half the available gains from trade were realized. However there were some deviations from the benchmark values computed under the assumption of perfectly competitive equilibrium. Emission permit prices were higher under baseline-and-credit trading and inventories of permits were unpredictably high in both treatments.
In the present chapter we investigate the complementary problem of adjustment on the capacity margin. That is, we hold emission intensity constant at the optimal level for each type of firm and allow firms to increase or reduce their productive capacity each decision period. We have three objectives. First we wish to see whether market equilibria emerge in these markets. Second, are there treatment effects that differentiate the two trading policies? Finally, do the theoretical competitive equilibria characterize the behavioral outcomes: does the baseline-and-credit policy lead to higher emissions and output than occur under cap-and-trade?
Methods
We ran six laboratory sessions (three cap-and-trade and three baseline-and-credit), each involving eight subjects, in September and October of 2004. All subjects were undergraduate students at McMaster University who had completed at least an introductory course in economics. Sessions lasted approximately 3 hours. For the first hour and a half, students received instruction and participated in four training periods using an alternate set of parameters.3 These training periods were rewarded by a flat fee of $10. Subjects then took a short break and returned to participate in ten paid rounds using the parameters reported here. After ten rounds they were informed of their results and paid privately in cash. Subjects earned between $18.75 and $53.25 with a mean of $38.91, including the training fee. The software implementation of the environment detailed below was programmed at McMaster University using Borland’s Delphi programming environment and the MySQL open source database.
Subjects were told that they represented firms that create emissions while producing output and selling it on a simulated market. We chose not to present the experiment in neutral terms, because we believed that the explicit emissions trading environment would help subjects understand the nature of the decisions they were making. There were four types of firms distinguished by emission intensity: two, four, six and eight emission units per unit of output for firm types A, B, C and D respectively. There were two subjects of each type. Each firm was initially given four units of productive capacity, k. Output could be produced at zero marginal cost up to the fixed capacity. The unit cost of capacity varied from $32 per unit for the dirtiest firms (type D) to $128 per unit for the cleanest firms (type A). Each firm created external costs proportional to its emissions, although the instructions did not explicitly inform subjects of this. The marginal damage of emissions (not provided to the subjects) was assumed constant at $16 per unit of emissions. These parameters were chosen to equate the marginal social cost (MSC) of each firm so that all could be present in final equilibrium.4 Figure 1.1 illustrates the short- and long-run cost curves for a typical firm.
There were two treatments: cap-and-trade and baseline-and-credit. In both treatments subjects were started off at the cap-and-trade equilibrium, which was chosen to coincide with the social optimum. In the cap-and-trade treatment 160 permits were distributed each period and aggregate production capacity began at 32 units of output. This implies an average emission intensity of five at the social optimum. We expect the system to remain stable at the equilibrium point with firms trading 32 permits every period. In the baseline-and-credit treatment we imposed a tradable performance standard of five, equivalent to the average emission intensity in the cap-and-trade treatment. In this treatment we expect the output and emissions to increase due to the inherent subsidy to output.
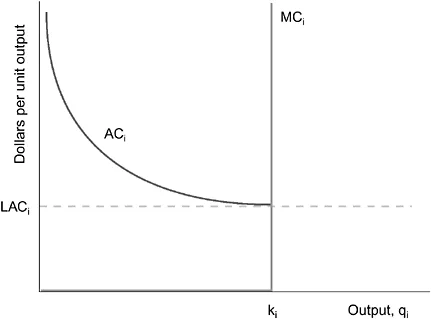
Figure 1.1 Firm cost curves.
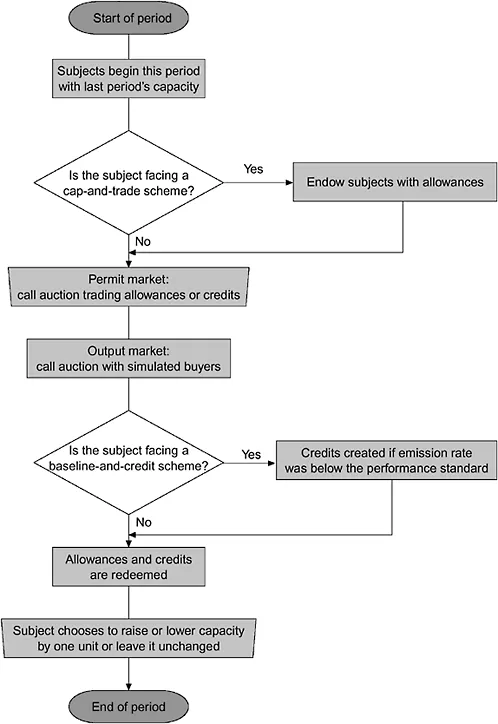
Figure 1.2 Sequence of events in a typical period.
The sequence of decisions differed slightly between the two treatments. A flowchart is provided as Figure 1.2. In the cap-and-trade treatment subjects began with capacity and allowance holdings determined in the previous period. They received an endowment of allowances. Their first action was to trade allowances in a multiple-unit uniform-price sealed bid-ask auction (call market).5 Subjects were permitted to enter three different price bids to purchase additional allowances. The first bid was the highest price the individual would pay...
Table of contents
- Cover Page
- Title Page
- Copyright Page
- List of figures
- List of tables
- List of contributors
- Foreword
- Introduction
- PART I Tradable permit markets
- PART II Common property and public goods
- PART III Regulation and compliance
- PART IV Valuation and preferences
Frequently asked questions
Yes, you can cancel anytime from the Subscription tab in your account settings on the Perlego website. Your subscription will stay active until the end of your current billing period. Learn how to cancel your subscription
No, books cannot be downloaded as external files, such as PDFs, for use outside of Perlego. However, you can download books within the Perlego app for offline reading on mobile or tablet. Learn how to download books offline
Perlego offers two plans: Essential and Complete
- Essential is ideal for learners and professionals who enjoy exploring a wide range of subjects. Access the Essential Library with 800,000+ trusted titles and best-sellers across business, personal growth, and the humanities. Includes unlimited reading time and Standard Read Aloud voice.
- Complete: Perfect for advanced learners and researchers needing full, unrestricted access. Unlock 1.5M+ books across hundreds of subjects, including academic and specialized titles. The Complete Plan also includes advanced features like Premium Read Aloud and Research Assistant.
We are an online textbook subscription service, where you can get access to an entire online library for less than the price of a single book per month. With over 1.5 million books across 990+ topics, we’ve got you covered! Learn about our mission
Look out for the read-aloud symbol on your next book to see if you can listen to it. The read-aloud tool reads text aloud for you, highlighting the text as it is being read. You can pause it, speed it up and slow it down. Learn more about Read Aloud
Yes! You can use the Perlego app on both iOS and Android devices to read anytime, anywhere — even offline. Perfect for commutes or when you’re on the go.
Please note we cannot support devices running on iOS 13 and Android 7 or earlier. Learn more about using the app
Please note we cannot support devices running on iOS 13 and Android 7 or earlier. Learn more about using the app
Yes, you can access Environmental Economics, Experimental Methods by Todd L. Cherry,Stephan Kroll,Jason Shogren in PDF and/or ePUB format, as well as other popular books in Business & Business General. We have over 1.5 million books available in our catalogue for you to explore.