A substantial portion of the world's rice is produced and consumed in the Asia and Pacific region. As much of the region's population depends on rice farming for consumption and livelihood, the demand for good quality statistics remains essential for effective policy formulation. Recent advances in remote sensing serve as a viable alternative to traditional methods of compiling agricultural statistics by responding to the emerging data requirements and overall needs of modern agriculture, especially for staple commodities such as rice. This publication outlines the procedures, methods and tools developed for generating statistics on paddy rice area and production using remote sensing and GIS techniques. It is intended to encourage and assist national statistical systems in piloting and adopting satellite-based techniques as an alternative to existing data collection methods, while enabling other interested readers to comprehend whether the adoption of these methodologies can improve the quality and timeliness of agricultural statistics. The handbook also serves as a complement to a massive online open course developed by ADB for crop area estimation.
eBook - ePub
Use of Remote Sensing to Estimate Paddy Area and Production
A Handbook
- 262 pages
- English
- ePUB (mobile friendly)
- Available on iOS & Android
eBook - ePub
Use of Remote Sensing to Estimate Paddy Area and Production
A Handbook
About this book
Trusted by 375,005 students
Access to over 1.5 million titles for a fair monthly price.
Study more efficiently using our study tools.
Information
Chapter 1: Introduction
1.1 The Importance of Rice in Asia and the Pacific
Rice is the most commonly consumed staple food across the world. In Asia and the Pacific, the average annual per capita consumption of rice increased from 67.15 kilograms (kg) in 1961 to 80.69 kg in 2013 (FAO 2018). Annual rice consumption varies across the region, with Southeast Asia averaging at 129.56 kg per capita in 2013, followed by South Asia at 81.40 kg per capita, and East Asia at 76.92 kg per capita (Figure 1.1). The world’s top national economies in terms of rice consumption are all from Asia and the Pacific: the People’s Republic of China (PRC), India, Indonesia, Bangladesh, Viet Nam, the Philippines, Thailand, Myanmar, and Japan (FAO 2018).
Asia and the Pacific also accounts for almost 90% of the rice produced globally, with the PRC, India, and Indonesia contributing the greatest volumes (Figure 1.2). Moreover, four of the top five rice exporters in the world are from Asia and the Pacific, namely India, Thailand, Viet Nam, and Pakistan (IRRI 2018).
Figure 1.1: Average Annual Rice Consumption by ADB Regions, 2013 (kg/capita)
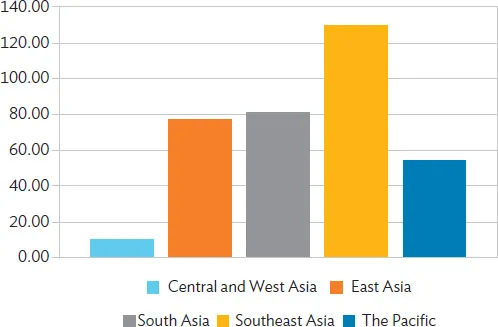
ADB = Asian Development Bank, kg = kilogram.
Source: Food and Agriculture Organization of the United Nations. FAOSTAT. http://www.fao.org/faostat/en/#data (accessed 8 November 2018).
Figure 1.2: Paddy Production by Economy in Asia and the Pacific, 2016 %

Source: Food and Agriculture Organization of the United Nations. FAOSTAT. http://www.fao.org/faostat/en/#data (accessed 8 November 2018).
The importance of rice to the Asia and Pacific region is even more emphasized in the context of climate change and its associated impacts, with production vulnerable to extreme weather events such as longer and more frequent drought spells interspersed with erratic patterns of violent storms, heavy rains, and flooding events. Given that a significant percentage of the world’s population resides in Asia and the Pacific, and that the regional population continues to grow exponentially, achieving rice self-sufficiency is going to become ever-more challenging using existing inputs such as land, labor, fertilizers, pesticides, types of rice seeds etc. Addressing these challenges requires well-designed agricultural development plans at the national level. Such plans rely on high-quality and timely data being delivered in a cost-effective manner, so that governments can provide support directly to the most vulnerable areas and populations.
1.2 Agricultural and Rural Statistics for Food Security
The 2018 United Nations (UN) Secretary-General Report on the Progress towards the Sustainable Development Goals indicated that, after years of decline, world hunger is on the rise again. The report shows that, from a rate of 10.60% of the world’s population in 2015, global undernourishment increased to 11.00% in 2016. This translates to an increase of about 38 million undernourished people, from 777 million in 2015 to 815 million in 2016. It also means that nearly one in nine individuals on the planet does not have enough to eat (UN 2018). Therefore, it is imperative that addressing food security continues to be a central focus for policymakers worldwide.
Goal 2 of the Sustainable Development Goals (SDGs) specifically aims to “end hunger, achieve food security and improved nutrition, and promote sustainable agriculture” (UN 2018). Attaining SDG 2 will require better access to nutritious food for everyone and the extensive promotion of sustainable agriculture, including improving the productivity, incomes, and agricultural practices of small-scale farmers. The goal can only be effectively monitored if timely, cost-effective, and high-quality data are available for generating agricultural and rural statistics.
1.3 Sources of Agricultural and Rural Statistics in Developing Economies
Accurate and reliable agricultural and rural statistics are vital in formulating agricultural policies and programs, monitoring policies on food security, promoting economic growth, and allocating resources in the agriculture sector. Moreover, current statistics must be readily available to allow for evidence-based policymaking. There is a need for economies to incorporate sustainable data collection and management practices into their national statistical systems, allowing them to produce accurate and reliable agricultural and rural data to inform and guide policy analysis and decision-making. Presently, most national statistical agencies compile agricultural and rural statistics either through administrative reporting systems or household surveys and censuses.
1.3.1 Administrative Reporting Systems
Many developing economies in Asia and the Pacific rely on administrative reporting systems in generating statistics on agricultural production and land use. The lack of financial resources to conduct agriculture surveys or censuses is one reason for opting to use data collected from local administrative authorities. There is also a need to further develop and strengthen statistical capacity in some economies before it is possible to implement large-scale agricultural censuses. Another pressing issue that needs to be addressed through continuous training and capacity development is the shortage of technical staff who have competent skills relevant to producing accurate agricultural statistics.
In an administrative reporting system, data are collected at the lower administrative levels, for instance, the village or municipal levels, and are then aggregated and forwarded up to the various administrative levels until national estimates are derived. The information is typically collected and compiled by agriculture personnel assigned in local villages or municipalities to assess crop and livestock production or identify land use. Data collection is usually done by observing harvests and interviewing key people—including village chiefs, farmers, and traders—in each locality.
The process of collecting data through administrative reports is less expensive, and can provide more timely estimates, than deriving statistics from censuses or surveys. However, information from these reports is prone to large measurement errors and can be considered subjective due to the nature of the data collection process. In addition to problems of accuracy, statistics derived from administrative reports are often found to be inconsistent with other sources of information.
A lack of validation procedures for agricultural estimates derived from administrative reports adds to the inconsistencies and, sometimes, the unreliability of the information. There have been cases where reports made by local administrative offices refer to planned or targeted figures, rather than being based on information collected from farmers or key people in the locality. In other instances, figures in administrative reports have been deliberately or inadvertently adjusted through human intervention, leading to incorrect information and flawed decision-making by local officials.
1.3.2 Probability Household Sample Surveys
Some of the more advanced economies across Asia and the Pacific regularly conduct household surveys to collect data on the agriculture sector. These surveys are usually done to gather information on specific commodity types, for example, livestock production surveys or crop production surveys, and are often conducted periodically, e.g., monthly or quarterly. Since these surveys are conducted more frequently than censuses, more up-to-date information on farm productivity is made available. This can help governments in making short-term decisions about providing agricultural inputs to farmers or in making production forecasts. Other agriculture-related household surveys are conducted to monitor food demand and consumption, track household food security, evaluate production costs, or assess labor force participation in agriculture.
In the Philippines, regular monthly surveys conducted by the government include the Rice and Corn Stocks Survey, Commercial and Municipal Fishery Survey, and Farm Prices Survey. Regular quarterly surveys include production surveys on rice and corn, other crops, livestock, fisheries, and food consumption. The Philippines also conducts agricultural labor surveys semiannually. Costs and returns surveys for specific commodity types have also been conducted, albeit on an ad hoc basis. Economies that do not regularly conduct agriculture surveys usually gather information related to agricultural area, agricultural production, and landholdings as part of living standards surveys or household income and expenditures surveys, which are conducted every 3 to 5 years.
By implementing probability sample surveys to derive statistics on crop areas or crop and livestock production, the precision levels of the estimates can be measured. Results of surveys, when properly managed and executed, also provide more reliable information than data from administrative reports. However, there is also the possibility of under- or over-estimating results. For instance, a farmer may be asked about the total area cultivated by the farming household to produce rice, but he or she may respond with the household’s total landholding (which could include areas dedicated to other crops, for raising livestock, or for purposes other than agricultural production). This can result in the overestimation of rice-cultivated areas. On the other hand, underestimation of rice-cultivated areas may occur if respondents leave out areas that are given to share-croppers but still used for rice cultivation. Since such surveys are usually conducted after the cropping season, some farmers may have limited or imprecise recall of information. Household surveys also require data validation and data processing, so results may not always be available in a timely manner. This is critical if policies or decisions need to be made for the following cropping season, such as provision of seeds or other inputs that farmers may need.
1.3.3 Censuses of Agriculture
National censuses of agriculture are conducted to provide information that will help describe the structure and characteristics of agriculture in an economy. Based on the recommendations of the Food and Agriculture Organization of the United Nations (FAO), as indicated on the World Programme for the Census of Agriculture 2020, national economies should consider including 23 essential items1 across 15 themes: (i) Identification and general characteristics, (ii) Land, (iii) Irrigation, (iv) Crops, (v) Livestock, (vi) Agricultural practices, (vii) Services for agriculture, (viii) Demographic and social characteristics, (ix) Work on the holding, (x) Intra-household distribution of managerial decisions and ownership on the holding, (xi) Household food security, (xii) Aquaculture, (xiii) Forestry, (xiv) Fisheries, and (xv) Environment/Green House Gas emissions. These data are collected directly from household or agricultural holdings, although data may also be collected at the community level. Community level data may include information on geography, socioeconomic conditions, community infrastructure and services, and community development programs in agriculture.2 Censuses of agriculture are usually conducted every 10 years, due to the intensive resource requirements of conducting a national census. However, some economies, such as India and Viet Nam, conduct agricultural censuses more frequently.
Implementing nationwide censuses is generally expensive and requires significant human resources. Thus, many developing economies depend on funding assistance from development agencies to be able to conduct agricultural censuses. In Bhutan, two previous agricultural censuses, conducted in 2000 and 2009, were both fully funded by the Danish International Development Agency. Likewise, agriculture censuses in Nepal have been either partially or fully funded by development organizations such as the Asian Development Bank (ADB), the FAO, and the United Nations Development Programme.
1.4 Using Remote Sensing for Agricultural and Rural Statistics
Recognizing the increasing demand for accurate, reliable, and more frequently measured data, national statistical agencies are becoming more interested in exploring technologically innovative and more efficient methods of collecting agricultural data. One of the methods that has gained traction in recent years is the application of remote sensing and satellite-based technologies.
Apart from applications in crop area and production estimation, remotely sensed data can also be useful to determine paddy field conditions during the growing stages of the crop. The technology can also be used to gather other agro-meteorological information that affect rice yield, and to quickly assess crop damage during times of calamity (e.g., damage caused by flood or drought). For example, after typhoon Haiyan hit the Philippines in November 2013 and devastated the northeastern part of Leyte Province, satellite images were released by the International Rice Research Institute (IRRI) in collaboration with sarmap SA and the Department of Agriculture-Philippine Rice Research Institute. Rice area maps were constructed from satellite images before and after the typhoon, showing that about 1,800 hectares of standing rice crops in the province had been damaged by flooding. This critical information assisted authorities in making urgent decisions on how to provide aid to the province (IRRI 2013).
A number of studies related to the use of remote sensing in the agriculture sector have been conducted in individual economies across Asia and the Pacific. There have also been various broader initiatives implemented by the global community to improve and expand the use of remote sensing for agriculture. For example, research has been conducted in Viet Nam on the application of remote sensing technology to estimating rice yield in Thai Binh province, Viet Nam (Guan et al. 2018). In addition, through a number of initiatives in the Mekong Delta, the use of satellite imagery has been explored to derive statistics necessary to address issues on severe drought, flooding, hydrologic changes, coastal erosion, and loss of biodiversity. For its part, the Ministry of Agriculture and Rural Development in Viet Nam has been taking advantage of the technology by using satellite images to develop land use maps, which allow users to collect information on crop growth.
In Thailand, studies have been conducted on the application of satellite-based technology for rice area and production estimation. In 2011, the Geo-Informatics and Space Technology Development Agency, in close collaboration with the Japan Aerospace Exploration Agency (JAXA) and Khon Kaen University (KKU) made a study on the use of remote sensing technology—specifically, synthetic aperture radar—for estimating rice crop area and forecasting rice production in Khon Kaen province. The KKU Model, a rice crop yield estimation model that relies on agro-meteorological satellite data, was used to estimate rice crop yield in the rainfed region of Khon Kaen province, as well as for rice crop monitoring in Suphan Buri province. Similar technology was applied in Roet province in 2012. The Office of Agricultural Economics in Thailand, likewise, has done some case studies on the application of remote sensing methods and objective yield surveys for rice yield estimation in the provinces of Sing Buri and Ang Thong.
With the objective of strengthening regional food security in Southeast Asia, the Association of Southeast Asian Nations (ASEAN) implemented the ASEAN Food Security Information System (AFSIS). The project included the development of a statistical system called the Agricultural Land Information System to estimate agricultural crop areas using optical satellite imagery available from Google Earth. A feasibility study to test the system was implemented in the Lao PDR and Cambodia in 2011 as well as in the Philippines in 2013 (AFSIS 2017).
On a larger scale, the Remote Sensing-Based Information and Insurance for Crops in Emerging Economies initiative was established by IRRI and its partners, and aims to reduce the vulnerability of rice smallholder farmers in low-income economies of Asia. The project employs satellite-based technology for mapping and estimating farm-level rice area and production for microinsurance purposes. It enables the production of rapid estimates of crop loss and damage, which can be used in food security programs and disaster response. The project is currently being implemented in Cambodia, India, the Philippines, Thailand, and Viet Nam, while implementation is on hold for Bangladesh and Indonesia (RIICE n.d.).
At the international level, the Group on Earth Observations Global Agricultural Monitoring Initiative was established to support agricultural development through remote sensing technology. The initiative was launched by the Group of Twenty (G20) Agriculture Ministers in June 2011 and aims to strengthen global agricultural monitoring by improving the use of remote sensing tools for crop production projections and weather forecasting. Recently, the initiative started collaborating with the Agricultural Market Information System, which is hosted by the FAO. With this collaboration, the two initiatives aim to enhance the use of satellite observations within current systems employed in area and yield estimation and to integrate earth observations into early-warning market indicators (GEOGLAM n.d.).
1.5 ADB’s Technical Assistance on Using Remote Sensing for Paddy Rice Statistics
In December 2013, ADB approved a major technical assistance project (Regional Capacity Development Technical Assistance 8369: Innovative Data Collection Methods for Agricultural...
Table of contents
- Front Cover
- Title Page
- Copyright Page
- Contents
- Figures and Tables
- Foreword
- Abbreviations
- Unit of Measure
- Chapter 1: Introduction
- Chapter 2: Basic Remote Sensing Concepts
- Chapter 3: Installing and Using the INAHOR-AD Software
- Chapter 4: Gathering Field Data and Conducting Accuracy Assessments
- Chapter 5: Crop Cutting Experiments and Farmer Recall Surveys for Paddy Yield Estimation
- Chapter 6: Assessing Accuracy, Revising INAHOR Outputs, and Estimating Paddy Production
- Appendixes
- References
- Footnotes
- Back Cover
Frequently asked questions
Yes, you can cancel anytime from the Subscription tab in your account settings on the Perlego website. Your subscription will stay active until the end of your current billing period. Learn how to cancel your subscription
No, books cannot be downloaded as external files, such as PDFs, for use outside of Perlego. However, you can download books within the Perlego app for offline reading on mobile or tablet. Learn how to download books offline
Perlego offers two plans: Essential and Complete
- Essential is ideal for learners and professionals who enjoy exploring a wide range of subjects. Access the Essential Library with 800,000+ trusted titles and best-sellers across business, personal growth, and the humanities. Includes unlimited reading time and Standard Read Aloud voice.
- Complete: Perfect for advanced learners and researchers needing full, unrestricted access. Unlock 1.5M+ books across hundreds of subjects, including academic and specialized titles. The Complete Plan also includes advanced features like Premium Read Aloud and Research Assistant.
We are an online textbook subscription service, where you can get access to an entire online library for less than the price of a single book per month. With over 1.5 million books across 990+ topics, we’ve got you covered! Learn about our mission
Look out for the read-aloud symbol on your next book to see if you can listen to it. The read-aloud tool reads text aloud for you, highlighting the text as it is being read. You can pause it, speed it up and slow it down. Learn more about Read Aloud
Yes! You can use the Perlego app on both iOS and Android devices to read anytime, anywhere — even offline. Perfect for commutes or when you’re on the go.
Please note we cannot support devices running on iOS 13 and Android 7 or earlier. Learn more about using the app
Please note we cannot support devices running on iOS 13 and Android 7 or earlier. Learn more about using the app
Yes, you can access Use of Remote Sensing to Estimate Paddy Area and Production by Lea Rotairo, Anna Christine Durante, Pamela Lapitan, Lakshman Nagraj Rao in PDF and/or ePUB format, as well as other popular books in Politics & International Relations & Statistics for Business & Economics. We have over 1.5 million books available in our catalogue for you to explore.