Over the past century, the number of species that have been transported to areas outside their native range has increased steadily. New pests and pathogens place biological pressure on valuable resident species, but strict bans may conflict with trading and travel needs. An overview of how the conflict can be managed using pest risk mapping and modelling, this book uses worked examples to explain modelling and help development of tool kits for assessment.
- English
- ePUB (mobile friendly)
- Available on iOS & Android
eBook - ePub
Pest Risk Modelling and Mapping for Invasive Alien Species
About this book
Trusted by 375,005 students
Access to over 1.5 million titles for a fair monthly price.
Study more efficiently using our study tools.
Information

1 The Challenge of Modelling and Mapping the Future Distribution and Impact of Invasive Alien Species
USDA Forest Service, Northern Research Station, St. Paul, Minnesota, USA
Abstract
Invasions from alien species can jeopardize the economic, environmental or social benefits derived from biological systems. Biosecurity measures seek to protect those systems from accidental or intentional introductions of species that might become injurious. Pest risk maps convey how the probability of invasion by an alien species or the potential consequences of that invasion vary spatially. These maps inform strategic and tactical decisions for invasive species management. Pest risk modellers must contend with the challenges of developing models that forecast the course or consequence of invasions and are more meaningful than could be obtained by chance, of demonstrating the validity of those models and of portraying results on maps in ways that will be useful for decision makers. Frequently, these forecasts depend on extrapolations from limited information to project how a species might be affected, for example, by changes in commerce, exposure to novel environments or associations with new dispersal vectors, or how these species might affect resident species or ecological processes. Consequently, pest risk maps often focus on one phase of the invasion process: arrival, establishment, spread or impact. Risk assessors use different analytical tools and information sources to address each phase. To be certain that pest risk models and maps are fully fit for purpose, models and maps must be critically evaluated at each stage of the development process. Invariably, errors will be revealed. The International Pest Risk Mapping Workgroup has offered a number of suggestions to improve the development of pest risk models and maps. In addition, short-term improvements are likely to be achieved through critical, objective assessments of model performance and greater transparency about model development.
Introduction to Pest Risk Maps
Abraham Maslow (1943) proposed a hierarchy of human needs to explain preconditions for certain human behaviours. Higher-level needs (e.g. self-actualization from which reason, creativity and morality emerge) cannot be met until more fundamental needs are satisfied. Modern concepts of biosecurity intertwine the most basal need for food and water to support life with the next most basic need to have safety and security. Indeed, biosecurity describes the measures taken ‘to manage risks of infectious disease, quarantined pests, invasive alien species, living modified organisms, and biological weapons. … [M]any of these problems are a subset of the issue of invasive alien species’ (Meyerson and Reaser, 2002). Ultimately, biosecurity is intended to protect human health, the environment or the economy from such biological threats. Pest risk maps for invasive alien species are pivotal tools for biosecurity.
Alien species (also known as exotic, non-native, non-indigenous or introduced species) are those species that have been accidentally or intentionally introduced to one or more areas outside their native geographic range but are by no means extraterrestrial. Often, these species are pathogens, plants or animals with a history of being problematic elsewhere in the world. Three dimensions (i.e. space, time and impact) affect whether a species is considered an invasive alien. In the USA, Executive Order 13112 defines an invasive alien species as ‘with respect to a particular ecosystem, any species, including its seeds, eggs, spores, or other biological material capable of propagating that species, that is not native to that ecosystem’ and ‘whose introduction does or is likely to cause economic harm or harm to human health’ (The White House, 1999). International Standards for Phytosanitary Measures similarly recognize a quarantine pest as ‘any species, strain or biotype of plant, animal, or pathogenic agent injurious to plants or plant products’ that is ‘of potential economic [or environmental] importance to the area endangered thereby and not yet present there, or present but not widely distributed and being officially controlled’ (FAO, 2012). Both definitions implicitly acknowledge that being alien is insufficient evidence by itself to consider a species an invasive pest.
Pest risk for invasive alien species refers to both: (i) the probability that a species will arrive, establish and spread (i.e. successfully invade) within an area; and (ii) the magnitude of harm should the invasion be successful (Orr et al., 1993; Ebbels, 2003). Economic harms result from lowered yields, reduced marketability, lost trade opportunities or increased management costs. Environmental harms include altered ecosystem functioning (e.g. fire regimes or nutrient cycling) or reductions in the abundance or diversity of resident taxa. Environmental harms can also occur if management activities affect non-target species (e.g. through drift of pesticides or predation by non-specific biological control agents). Environmental harms are considered particularly severe if threatened or endangered species might be affected. Social harms can occur if an invasive species or management activities interfere with benefits people draw from an ecosystem. However, it is not reasonable to assume an invasive alien species will be present in all places at all times; thus, risks posed by invasive alien species have spatial and temporal contexts.
Pest risk maps convey how risks from invasive alien species vary spatially within an area of concern and reflect underlying models of the factors that govern the course of invasion and the effects of invasive alien species on the structure or function of ecosystems (Venette et al., 2010). Some of these models are derived from heuristic descriptions of conditions necessary for an alien species to complete each phase of an invasion or have an impact. Other empirically based, statistical models infer quantitative relationships between a response variable (e.g. the probability of pest arrival) and a number of covariates (i.e. independent or predictor variables). Conceptual mathematical models follow a logical formalism to deduce relationships among variables (e.g. factors that affect species’ spread rates). Many models for pest risk maps are based on more general ecological theories about factors that affect species’ distributions, rates and patterns of spread, or the outcome of species’ interactions. Although the goal of a pest risk map is to characterize how the probability and consequences of invasion by an alien species vary within an area of concern, in practice, pest risk maps frequently address just one or a few components of pest risk. For example, a map could focus on the suitability of the climate for pest establishment within an area of concern, with the rationale that a species which fails to find a suitable climate cannot establish, spread or have a lasting impact.
A well-crafted risk map serves a number of purposes. From a pragmatic perspective, risk maps can be powerful tools to help managers (e.g. foresters, farmers, pestsurvey coordinators and some policy makers) select appropriate strategies and tactics with which to mitigate species’ risks. Such risk mitigation (i.e. biosecurity) strategies can be classified broadly as prevention, eradication, suppression and restoration, which correspond generally with the arrival, establishment, spread and impact of invasive alien species (Venette and Koch, 2009). Pest risk maps also inspire critical thought about: (i) the adequacy of current theory, models and data to characterize risks from biological invasions; and (ii) alternative explanations for the course of an invasion or the impacts that have been realized, as was suggested by Koch (2011) for maps of human disease. This chapter describes long-standing goals for pest risk maps and introduces the general process by which pest risk maps are created. General models that have been applied to address different stages of the invasion process are briefly discussed. Types of errors associated with many pest risk models are presented and discussed with respect to measures of model performance. The chapter concludes with a series of recommendations that would help to improve the future development of pest risk models and maps.
An Historical Example of a Pest Risk Map
No consensus exists about when the first modern pest risk map was created. Figure 1.1 is likely among the first maps that begin to address contemporary concepts of pest risk, although the map was not created with the formal definition of pest risk in mind. In the 1870s, the San Jose scale, currently Quadraspidiotus perniciosus, was detected in North America for the first time in California’s San Jose Valley (Howard and Marlatt, 1896). The pernicious insect, now recognized as native to parts of Asia, feeds on several deciduous fruit trees, such as peaches, plums, apples and pears, and is easily moved on nursery stock. Few details have been published about the creation of this map, but two pragmatic questions seem to have motivated its production: where was the insect likely to spread within the USA and what major fruit production regions might be affected?
This map (Fig. 1.1), published in 1896, shows the distribution of San Jose scale up to that time relative to ‘life zones’ in the conterminous USA. The life zones had been proposed by C.H. Meriam to distinguish areas that were especially suitable, or unsuitable, for many plants and animals. Meriam’s map identifies five major zones in North America: boreal, transition, upper austral, lower austral and tropical. Known occurrences of San Jose scale seemed to occur ‘within or near the so called austral life zones’ (Howard and Marlatt, 1896, p. 33). The supposition at the time was that San Jose scale should be able to continue to spread within these regions wherever suitable hosts occurred. The map was developed before modern quarantine regulations were in place, so it was intended to reassure fruit producers in New England and portions of Pennsylvania, New York, Michigan and Wisconsin that the insect would ‘not establish itself to any serious extent’ (Howard and Marlatt, 1896, p. 35). At the time the map was published, Howard and Marlatt (1896) cautioned about the uncertainty in this forecast by acknowledging that ‘its possibility is suggested by what we know up to the present time. Against its probability may be urged the fact that, in general, scale insects … are seldom restricted by geographical limitations which hold with other insects’ (Howard and Marlatt, 1896, p. 35). The precautionary note has proven justified. San Jose scale is now established in all conterminous states except Wyoming, North Dakota, South Dakota and Maine (CABI, 1986), but is often kept under control by a suite of natural enemies (Flanders, 1960).
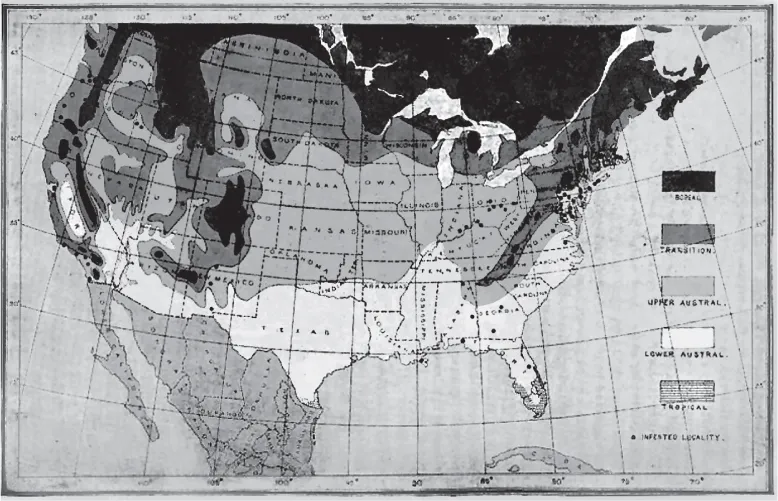
Fig. 1.1. An early ‘pest risk’ map – the historical distribution of San Jose scale (black dots) in the conterminous USA relative to C.H. Meriam’s life zones. (Reproduced from Howard and Marlatt, 1896.)
The General Challenge for Pest Risk Assessors
Pest risk modellers and mappers face a three-part challenge. The first part of the challenge is to develop a model that gives a more meaningful forecast of the course and consequence of a biological invasion than would be obtained by random chance or from obvious, intuitive models (e.g. a plant pest will occur and cause damage anywhere its host plants occur). Models are often needed for species that have not yet arrived in an area of concern. In these cases, pest risk modellers cannot develop or test models with empirical observations on the distribution, biology or behaviour of a species within the area of concern. They must extrapolate from what is known about a species in its native or adventive (i.e. areas where it has invaded) range, from studies in biosecure laboratories or from inferences drawn from taxonomically related species. Further, most pest modellers must rely on a simplifying assumption that individuals in an invading population are equivalent to individuals from the native range and will be equivalent to future generations (i.e. no significant genotypic or phenotypic changes have occurred or will occur). If an invasive alien species has arrived within an area of concern, initial observations of distribution, dynamics or impact may test the robustness of current knowledge or provide the foundation for a new model.
The second part of the challenge is to demonstrate the validity of the pest risk map and the underlying model. All models (physical, conceptual, statistical or mathematical) are an abstraction of reality. They are never intended to incorporate all of reality. Rather, models are intended to capture enough reality to be useful. What constitutes enough or useful is often a matter of debate. Venette (Chapter 15 in this volume) provides a typology of validity, drawn from the social sciences, to apply to pest risk maps. One might reasonably consider the map to be a hypothesis, so the validity of the model would be demonstrated though empirical testing (i.e. comparisons of model outputs with observations that are independent of the model). Such evaluation would also formally confirm that the first challenge was met. However, in many cases, relevant empirical observations are likely to be rare or non-existent, at least in the short term. So, pest risk modellers must use other lines of reasoning to argue for model validity. In some cases, arguments for or against a model reduce to so-called first principles with respect to content or construct validity. First principles are axiomatic statements about forces that drive biological invasions, affect population dynamics or affect invasion outcomes. Given the imperfect state of knowledge about biological invasions, debates based on first-principle arguments are seldom resolved, except in the most extreme cases.
Once a model is created and its validity established, the third part of the challenge is to portray results in a way that will be useful for decision making. The risk mapper must consider the required geographic extent (e.g. continent, country, region or parcel) and resolution of the map. Resolution (i.e. grain) refers to the size of grid cells (i.e. pixels) that comprise the map; smaller grid cells provide higher resolution. High-resolution maps can be visually appealing but come with additional uncertainty as fine-scale information is often interpolated from distantly neighbouring observations. Because all maps have some degree of distortion, a consequence of plotting the Earth’s curved surface in two dimensions, thought should be given to the appropriate map projection that accurately represents area or distances (DeMers, 1997). Model results should be reported with sufficient precision to support decision making, but should not be so precise as to visually overwhelm the end user (Smans and Estève, 1996). Consider a model output, such as the Ecoclimatic Index from CLIMEX (Sutherst and Maywald, 1985; Sutherst et al., 2007), with values from 0 to 100. At the extreme, each model output could be associated with a unique colour and that colour scheme applied to the map, but subtle variations among 101 colours may be difficult to distinguish. Typically, all possible model results are divided into classes. For example, Vera et al. (2002) interpret an Ecoclimatic Index of 0 as a climate that is unsuitable for pest establishment; values of 1–10 are marginal; values of 11–25 are suitable; and values >25 are very suitable. A unique colour, stippling or shading is assigned to each class and that classification scheme is applied to each grid cell. For many pest risk maps, red designates the highestrisk areas (i.e. red zones or hot spots).
The Production of Pest Risk Maps
Despite calls for more pluralistic approaches to ecological risk analysis (NRC, 1996), the creation of pest risk maps regularly follows a technocratic approach with distinct roles for assessors, managers and stakeholders. The assessor (i.e. pest risk modeller/mapper or analyst) typically has advanced academic training in entomology, plant pathology, weed science or one of the other core biological disciplines that provide foundational knowledge about taxa that might become invasive alien species (Worner et al., 2014). Assessors may also have experience with computer science or geographic information systems or be asked to collaborate with individuals who do. Formal training in pest risk assessment is rare but is slowly increasing (Worner et al., 2014). Individual assessors or assessment teams have the technical knowledge to produce pest risk models and maps or to evaluate such products from others.
Risk managers are those decision makers, end users or land managers who use pest risk models to mitigate the likelihood or impacts of pest invasion. Risk managers are often senior personnel within governmental agencies. In the ideal case, distinctions between risk assessors and managers are maintained to prevent undue outside pressures from influencing the pest risk model or map. Likewise, risk managers use pest ...
Table of contents
- Cover Page
- Title Page
- Copyright Page
- Contents
- Preface
- 1 The Challenge of Modelling and Mapping the Future Distribution and Impact of Invasive Alien Species
- 2 Mapping Endangered Areas for Pest Risk Analysis
- 3 Following the Transportation Trail to Anticipate Human-mediated Invasions in Terrestrial Ecosystems
- 4 Simulation Modelling of Long-distance Windborne Dispersal for Invasion Ecology
- 5 Using the MAXENT Program for Species Distribution Modelling to Assess Invasion Risk
- 6 The NCSU/APHIS Plant Pest Forecasting System (NAPPFAST)
- 7 Detecting and Interpreting Patterns within Regional Pest Species Assemblages using Self-organizing Maps and Other Clustering Methods
- 8 Modelling the Spread of Invasive Species to Support Pest Risk Assessment: Principles and Application of a Suite of Generic Models
- 9 Estimating Spread Rates of Non-native Species: The Gypsy Moth as a Case Study
- 10 Predicting the Economic Impacts of Invasive Species: The Eradication of the Giant Sensitive Plant from Western Australia
- 11 Spatial Modelling Approaches for Understanding and Predicting the Impacts of Invasive Alien Species on Native Species and Ecosystems
- 12 Process-based Pest Risk Mapping using Bayesian Networks and GIS
- 13 Identifying and Assessing Critical Uncertainty Thresholds in a Forest Pest Risk Model
- 14 Making Invasion Models Useful for Decision Makers: Incorporating Uncertainty, Knowledge Gaps and Decision-making Preferences
- 15 Assessing the Quality of Pest Risk Models
- Index
- Footnotes
Frequently asked questions
Yes, you can cancel anytime from the Subscription tab in your account settings on the Perlego website. Your subscription will stay active until the end of your current billing period. Learn how to cancel your subscription
No, books cannot be downloaded as external files, such as PDFs, for use outside of Perlego. However, you can download books within the Perlego app for offline reading on mobile or tablet. Learn how to download books offline
Perlego offers two plans: Essential and Complete
- Essential is ideal for learners and professionals who enjoy exploring a wide range of subjects. Access the Essential Library with 800,000+ trusted titles and best-sellers across business, personal growth, and the humanities. Includes unlimited reading time and Standard Read Aloud voice.
- Complete: Perfect for advanced learners and researchers needing full, unrestricted access. Unlock 1.5M+ books across hundreds of subjects, including academic and specialized titles. The Complete Plan also includes advanced features like Premium Read Aloud and Research Assistant.
We are an online textbook subscription service, where you can get access to an entire online library for less than the price of a single book per month. With over 1.5 million books across 990+ topics, we’ve got you covered! Learn about our mission
Look out for the read-aloud symbol on your next book to see if you can listen to it. The read-aloud tool reads text aloud for you, highlighting the text as it is being read. You can pause it, speed it up and slow it down. Learn more about Read Aloud
Yes! You can use the Perlego app on both iOS and Android devices to read anytime, anywhere — even offline. Perfect for commutes or when you’re on the go.
Please note we cannot support devices running on iOS 13 and Android 7 or earlier. Learn more about using the app
Please note we cannot support devices running on iOS 13 and Android 7 or earlier. Learn more about using the app
Yes, you can access Pest Risk Modelling and Mapping for Invasive Alien Species by Robert C Venette in PDF and/or ePUB format, as well as other popular books in Biological Sciences & Biology. We have over 1.5 million books available in our catalogue for you to explore.