![]()
CHAPTER 1
Introduction
Many, indeed most, of our everyday methods of measurement are indirect. Objects are weighed by observing how much they stretch a spring, temperatures measured by observing how far a mercury column moves along a glass capillary. The concern of this book will not be with that sort of indirectness, but with methods wherein the distribution of some quantity is to be estimated from a set of measurements, each of which is influenced to some extent by all values of the unknown distribution: the set of numbers which comprises the “answer” must be unravelled, at it were, from a tangled set of combinations of these numbers.
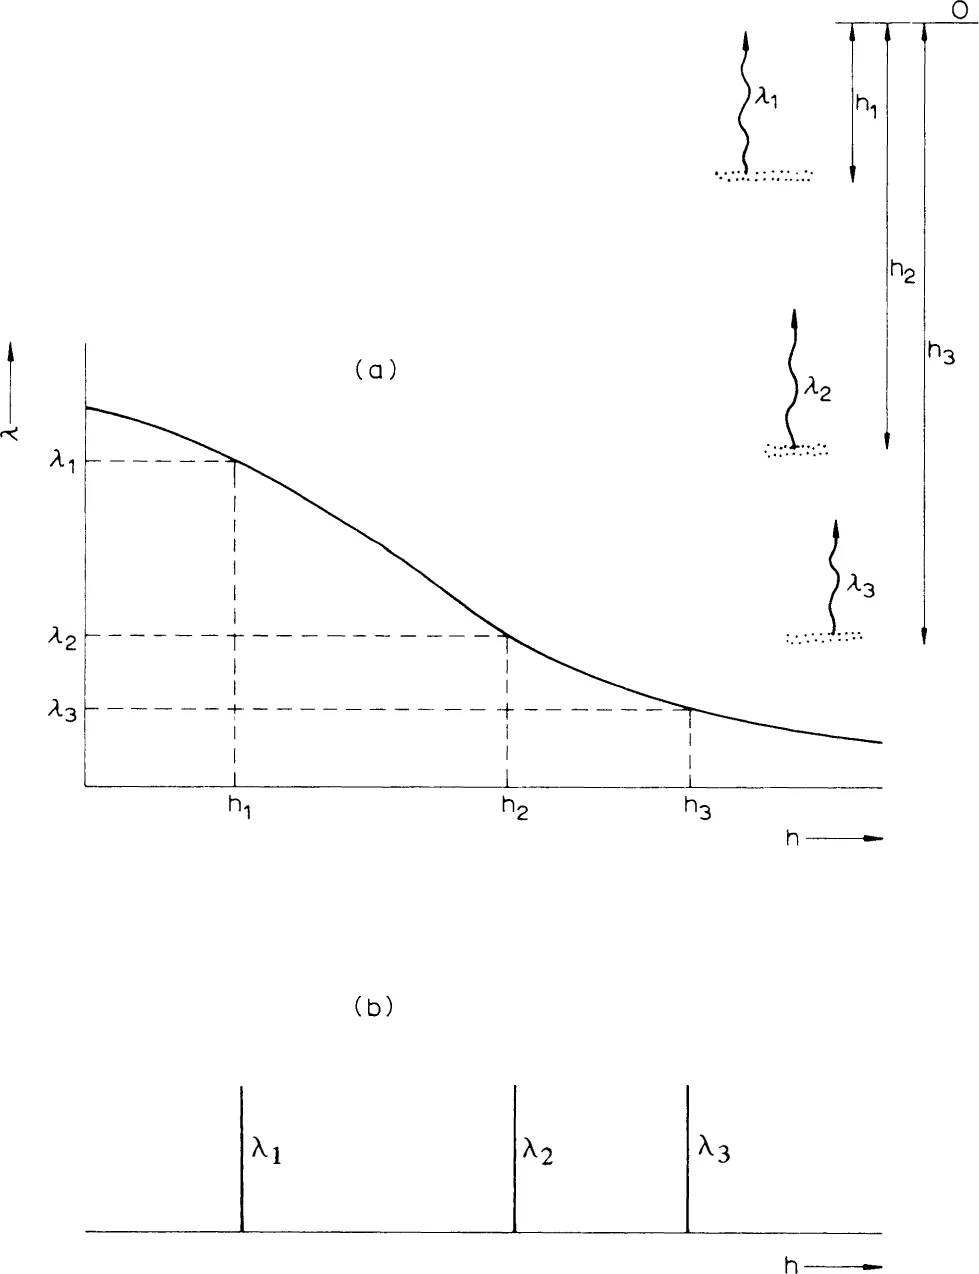
Fig. 1.1. Schematic diagram for an indirect sensing measurement such as satellite-based atmospheric temperature profile measurement.
An illustration may help to make clear what is meant. Suppose that any level in the atmosphere radiated infrared energy in an amount which depended in a known way on its temperature (which indeed is true), and suppose also that each level radiated energy only at a single wavelength characteristic of that level and emitted by no other level (which is not at all true). Clearly, we could place a suitable instrument in a satellite above the atmosphere and obtain the temperature at any level by measuring the infrared intensity at an appropriate wavelength, which could be obtained from a graph of wavelength against height as in Fig. 1.1a. From Fig. 1.1a we could construct Fig. 1.1b which shows for an arbitrary set of wavelengths λ1, λ2, ..., λn the relative contribution of various height levels to the measured radiation at that wavelength. Because of the imagined unique relation between height and wavelength, these contributions are zero everywhere except at the height which Fig. 1.1a indicates to be radiating at that particular wavelength.
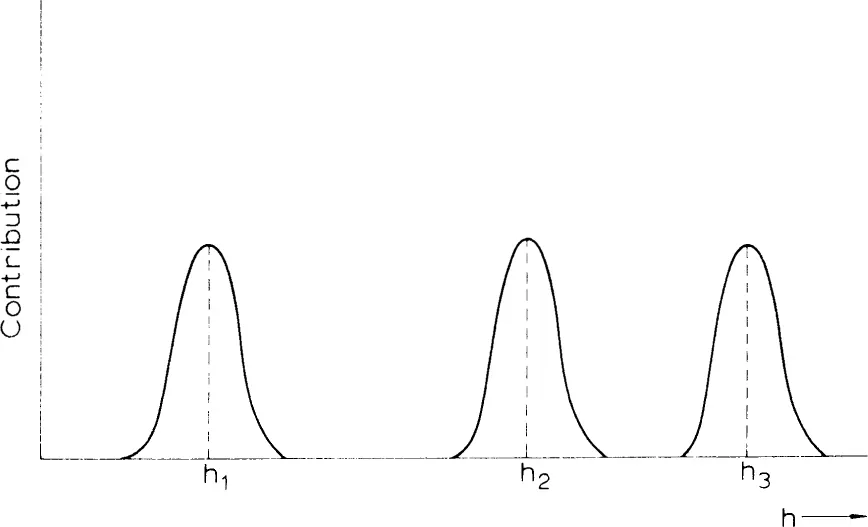
If the ideal relationship existed the graph of Fig. 1.1b would only be an awkward and less informative version of the graph of Fig. 1.1a. But suppose now we wish to describe the situation where some blurring exists — where the level given in the figures contributes most strongly to the corresponding wavelength, but the neighboring levels also contribute to an extent that diminishes as one moves farther from the level of maximum contribution. This cannot readily be shown in a figure similar to Fig. 1.1a, but is easily shown by the simple modification to Fig. 1.1b which is seen in Fig. 1.2. Each relative contribution is still in a sense localized around a single level, but it is no longer a spike but rather a curve which falls away on both sides from a central maximum. The wider that curve the more severe the blurring or departure from the one-to-one correspondence between wavelength and height.
Fig. 1.2. A version of Fig. 1b, corresponding to the practical situation where the measured radiation does not originate from a single level, but where different levels contribute differently.
1.1. MATHEMATICAL DESCRIPTION OF THE RESPONSE OF A REAL PHYSICAL REMOTE SENSING SYSTEM
To describe the blurring process just mentioned in a mathematical way is not difficult. Let
f(
x) be the distribution being sought and let
K(
x) represent the relative contribution curve — since there is one such curve for every wavelength we must add a subscript making it
Ki(
x) or, alternately, we may specify the wavelength dependence by considering the relative contributions to be a function of the two variables and writing it as
K(
λ,
x). In most situations the subscript notation accords better with the facts of the practical situation where a
finite number
n of wavelengths
λ1,
λ2, ...,
λn are utilized. The difference is only one of notation; we have
K(
λi,
x) ≡
Ki(
x). A measurement at wavelength
λi involves radiation not just from a height (say
xi) at which
Ki(
x) is a maximum, but also from the neighboring region within which the contribution and
Ki(
x) do not vanish. If the interval between
x and
x + Δ
x contributes to the
ith measurement the amount
f(
x)
Ki(
x) Δ
x then the total measured radiation is clearly ∫
Ki(
x)
f(
x) d
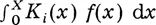
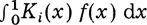
x; the limits to be placed on this depend on the exact circumstances. In almost all experiments
x cannot be negative and in many experiments it does not exceed an upper limit
X. We may find indirect sensing problems wherein the relevant integral is either
or
. In the latter case it is always possible to redefine the independent variable from
x to
x/X and thereby to make the integral
.
Convolution
If the blurring functions or contribution functio...