![]()
Finding a Range and Usage
Before you begin messing around with your data, you need a way to organize it and the most common method of organizing a dataset is to turn that dataset into a range of numbers. But what does a range mean? A range represents the smallest value on the left side of the dataset with the representation of the highest values on the right side of the dataset or the top side of the dataset. So, for a group of numbers [0,10,5,6,7] the range would be [0-10].
Once you have placed your numbers from least to greatest, in a basic sense, you are now able to look at the data points and categorize them by using qualitative measures or by using quantitative measures. If one is looking at a dataset where the numbers correlate to qualities in an item or a thing, then a qualitative approach should be taken but if the numbers in your dataset are representative of quantities then a quantitative approach should be adopted.
Median and Interquartile Range
Median and Interquartile range are very simplistic topics with very complex words attached to it and all it involves is finding the middles of the middle. Let’s say that we have a range of numbers from 1 to 20 where we are dealing with the even numbers, as well as numbers 1 and 11. This means that we would have 1, 2, 4, 6, 8, 10, 11, 12, 14, 16, 18, 20. The first step in the process is to find the median number, and so since we have twelve numbers that means that we need to find the middle two numbers (6th and 7th number) and find the common number between them. The common number between 10 and 11 is 10.5. Now that we have found our median, we need to find the middle median of the left and right sides. The middle median of the left side is 4 (3rd number) while that of the right side is 16 (9th number). Next, we need to find the difference between these two numbers. This would mean that we subtract 4 from 16 and this gives us 12 and so our interquartile range is 12. As I said, this is an easy thing to figure out, on a small scale, but is attached to a somewhat complex sounding name. The reasoning behind the name is that you are providing a range between two different percentiles in your dataset, specifically the 75-percentile marker and the 25-percentile marker.
The Five Number Summary
Most of the data that is worked on relies on the five number summaries and though this elusive name suggests that there are five numbers that summarizes the entirety of your data, this is the truth. The five-number summary is made up of the smallest quantitative measurement that you can possibly have in your data set, the first 25% of the dataset otherwise known as the first quartile, the median of a dataset, the 75% of the dataset otherwise known as the third quartile, the maximum possible quantitative value and the inside of a dataset. As you already saw with interquartile range, we utilized the median to find the first quartile and the third quartile and found our interquartile range by subtracting the first quartile from the third quartile. These five numbers will represent almost all your data all the time if you are ever taking a quantitative approach towards your data.
Differentiating Different Sampling Methods
Probability Sampling
In order to go through this topic, we need to go over a few variables and functions that you will need to keep in mind as we move forward. In Probability Sampling, you have a quantitative number representing the sampling frame and the sample pertaining to the amount of cases in each one. This is represented by N for frames and n for samples. The functions are NCn, which just represents the number of times that n to N form combinations or subsets and f, which is the fraction of samples found in a sample frame a.k.a. n/N. Now that we got that out of the way, there are five methods that fall underneath Probability Sampling, but what is Probability Sampling? Simply put, it is a series of methods (from which you choose one of them) used to randomly select a sample.
Simple Random Sampling
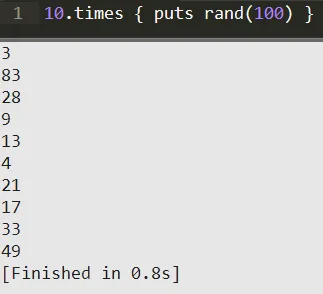
Alright, so let’s get started with the simplest of them all. The objective of this sampling method is to select the sample size out of the sample frame where each sample has an equivalent claim to be used. The procedure to do such a thing is usually just a simple randomizer made in a program, such as:
As you can see from the code, we chose to print out a random number from 1-100 ten times. In the Simple Random Sampling, this would be explained as using a sample of 10 from a sample frame of 100. We would then utilize these randomly chosen 10 things inside of the sample set to determine something. Our NCn in this case would be 100C10 and our f would be 10% as 100/10 is 10. Simple, right?
Stratified Random Sampling
Stratified Random Sampling is similar, but it takes it a little bit further. Let’s say that we have a sample frame of 100 black haired individuals and we initially chose a sample set of 10. We would then divide the 100 individuals into 10 sample groups where each group shared one common aspect that was different from the other groups. We would then take 1 from each group, just as random as before, in order to get our sample group of 10. The whole point of this is to divide the sample frame into groups that don’t overlap each other so this is more of a categorical methodology since things like red and black don’t naturally overlap.
Systematic Random Sampling
Systematic Random Sampling is a little bit different from the previous two because it is a bit more complicated. First, you number all the given elements in your range in an ordinal fashion. You need to choose your sample set from the sample frame. Now here is where it differs; your interval size will be f. You will now need to select a random number from 1 to your output off. You will now go to each sample set and take the random number for that sample set. So, going back to the example, we would take the 6th person from each group.
Cluster (Area) Random Sampling
Cluster Sampling was primarily invented to handle situations where your data points are stretched way outside of a normally controllable environment, such as travelling to different counties in a state to visit inspection sites for your sample set. It’s pretty straightforward:
- Divide up your sample frame into bordered off sections (clusters)
- Use a randomizer technique to select your sections
- The selected sections now become your samples where you will use them to do all of your needed measurements
Multi-Stage Sampling
The above are the most common forms of sampling and they are taught to beginners in this field, but the truth is that statistical analysts almost never use something so simple. Imagine if you have a sample from of one billion individuals and you were to select a sample set of 10% from that, would you be able to perform the measurements in your lifetime? Needless to say, we must combine these methods and create our own method to randomly select our samples in order to represent a wide array of things we wish to study. This combination of sampling methods is known as Multi-Stage Sampling.
Non-probability Sampling
Non-probability sampling means that you did not randomize your choice. Often, many statistical analysts will avoid this unless they have a specific set that they want to investigate. This set may be something they want to investigate because of density issues, limitations on methodologies, or simply lack of the considerable amount of time it might take to complete randomized sampling. In this case, we would choose a non-probable sample in order save on something but we risk not truly representing the sample set we’re considering.
Convenience Sampling
Convenience sampling is simply choosing whatever is convenient for you to choose at the time and using that as the sample in your sample frame...