![]()
Chapter 1
Introduction
Abstract. This chapter introduces this book. It describes the representation of data in the time, frequency and time–frequency domains. It also describes how fractal characteristics can be extracted from data in the time (or space) domain. It then describes the common mistakes encountered when applying artificial intelligence methods. Finally, it describes machine-learning techniques that are studied in this book. These are the multilayer perceptron, radial basis function, automatic relevance determination, support vector machines, fuzzy logic, rough sets, auto-associative network, Bayesian networks, hybrid models, online learning, causality, Gaussian mixture models, Hidden Markov models and reinforcement learning.
1.1Introduction
Machine learning requires data to make decisions. The type of dataset, its values, how it is scaled, the amount of noise in the data, its sensitivity with respect to the outcome and how features are selected are all important in the effectiveness of machine learning. This chapter introduces data handling methods as well as artificial intelligence methods described in this book. The data handling methods introduced in this book are the domains in which data should be represented, and these are the time (or space) domain, frequency domain and time (or space)–frequency domain. These domains are important because, for example, in finger print recognition problems, the frequency domain methods are more effective than the time domain methods. Another example where frequency domain methods are more effective than the time domain methods is in condition monitoring of mechanical structures using vibration data (Marwala, 2012). It has been found that for non-stationary data, the time–frequency techniques are more viable than the frequency domain methods (Marwala, 2012). Some of the time domain methods explored are data processed using averages, variances and kurtosis (Marwala, 2013). The frequency domain methods are obtained using the Fourier transform. Fourier discovered many years ago that a signal can be represented in terms of sinusoids of varying frequencies and amplitudes. He then discovered that those frequencies are the natural frequencies of the structure or system under consideration. There are many types of the time–frequency analysis and these include Wigner–Ville distribution, short-time Fourier transform and the wavelet transform. This chapter also describes the fractal methods which have been found to be useful in stock market prediction (Lunga and Marwala, 2006a; Lunga, 2007). The chapter describes some important data handling methods such as scaling and accuracy measurements (Hurwitz and Marwala, 2012). This chapter also describes artificial intelligence methods studied in this book, and these include the multi-layer perceptron (MLP), radial basis function (RBF), automatic relevance determination (ARD), support vector machines (SVM), fuzzy logic, rough sets, auto-associative network, Bayesian networks, hybrid models, online learning, causality, Gaussian mixture models, Hidden Markov models and reinforcement learning.
1.2Time Domain Data
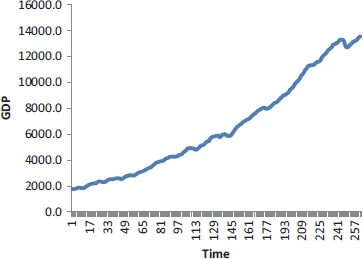
Time domain representation of data is called time series data. It is called this because it is presented as a function of time. Marwala (2013) presented the quarterly GDP of the United States as a function of time, and this is shown in Figure 1.1. We observe in this figure that the GDP has grown as a function of time. Several statistical parameters can be derived from this dataset, and these include the average, variance and kurtosis (Marwala, 2007). Marwala expressed the data in Figure 1.1 in terms of percentage change of GDP, and this is given in Figure 1.2.
Figure 1.1The quarterly GDP of the United States from 1947 to 2012.
Figure 1.2The percentage change of GDP of the United States from 1947 to 2012.
1.2.1Average
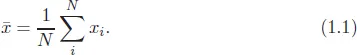
The average is the quantification of the central tendency of data. For
N data points, the average
of series
x1,
x2, . . . ,
xN is as follows (Hand, 2008; Marwala, 2013):
The use of averages includes studying the financial crisis (Ni et al., 2013), portfolio selection (Pavlov and Hurn, 2012) and in double action market (Chiarella et al., 2012).
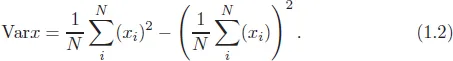
1.2.2Variance
Variance is the measure of the spread of the data and is estimated by calculating the difference between the average value of the sum-of-squares and the square of the sum of averages. This is written as follows (Hand, 2008; Marwala, 2013):
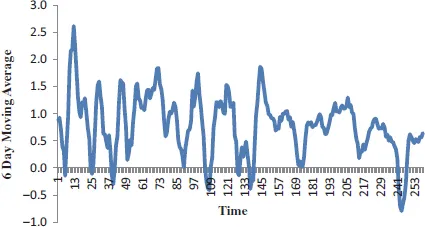
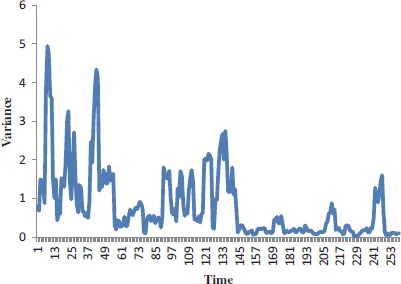
This has been used to estimate the income variance in cross-sectional data (Uematsu et al., 2012), the rise and fall of S&P500 variance futures (Chang et al., 2013), to analyse the relationship between accruals, cash flows and equity returns (Clatworthy et al., 2012) and to estimate risk in commodity markets (Prokopczuk et al., 2017). Marwala (2013) transformed the data in Figure 1.2 into the 6-time unit moving average and variance and this results are shown in Figures 1.3 and 1.4, respectively.
In this figure, it is observed that in the earlier years, the growth of the GDP was more volatile than in the later years.
Figure 1.3The 6-unit period moving average of the percentage change of GDP of the United States from 1947 to 2012.
Figure 1.4The 6-unit period moving variance of the percentage change of GDP of the United States from 1947 to 2012.
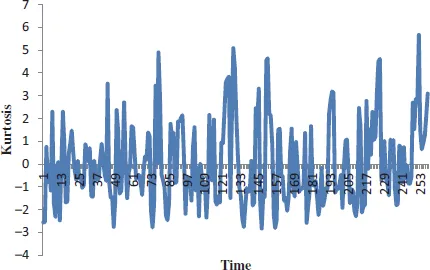
Figure 1.5The 6-unit period moving kurtosis of the percentage change of GDP of the United States from 1947 to 2012.
1.2.3Kurtosis
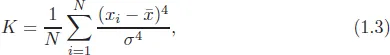
To analyse a situation where there is occasional spiking of data, we use kurtosis. Kurtosis has been successfully used to study the information content prior to earnings announcements for stock and option returns (Diavatopoulos et al., 2012), in portfolio rankings (di Pierro and Mosevichz, 2011), in hedging (Angelini and Nicolosi, 2010), in risk estimation (Dark, 2010), in rolling bearing elements (Liu et al., 2018) and financial time series (Xu and Shang, 2018). The calculated kurtosis value is usually normalized by the square of the second moment. A high value of kurtosis shows a sharp distribution peak. It indicates that the signal is impulsive in character. Marwala (2013) transformed the data in Figure 1.2 into kurtosis, the results in Figure 1.5 were obtained. Kurtosis is written as follows (Hand, 2008; Marwala, 2013):
where
is the mean and
σ is the variance.
1.3Frequency Domain
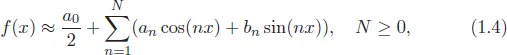
The frequency domain analysis is based on the Fourier series. The Fourier series states that every periodic function can be estimated using a Fourier series expressed in terms of sines and cosines (Marwala, 2013). This implies that each signal is represented in terms of a series of cycles with different amplitudes and frequencies. The function f(x) can be estimated using the Fourier series as follows (Moon and Stirling, 1999; Marwala, 2013):
where
and
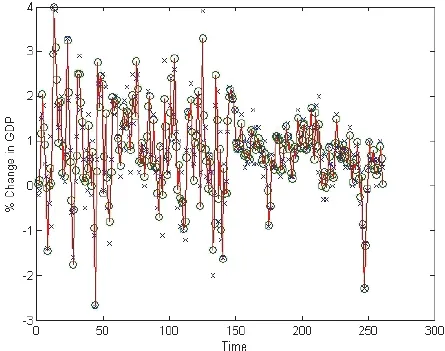
Marwala (2013) used this procedure in Equations (1.4)–(1.6) to estimate Figure 1.2 and this results in Figure 1.6.
Figure 1.6The Fourier series reconstruction of the percentage change of GDP of the United States from 1947 to 2012. Key: ×: 10 terms ○: 100 terms.
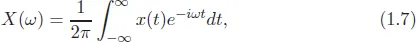
The representation of a signal using sine and cosine functions implies that we can transform a time domain signal into the frequency domain. This we achieve by applying the fast Fourier transform (FFT), which is a computationally efficient technique for estimating the Fourier transform through exploiting the symmetrical relationship of the Fourier transform. If the FFT is applied to the function, x(t), can be written as follows (Moon and Stirling, 1999; Marwala, 2013):
where ...