3.1. Data
Two data sets are used in this case: the retention data and the account master data. The retention data includes information on customer phone calls made in January 2012. The data set consists of 195,694 records in total. Each record represents a customer’s phone call and contains 162 fields.
The account master data is a large data set with 60,309,524 records and 504 fields. Each record represents a credit card account. All accounts opened in the bank from July 1980 to March 2012 are included in the data set. The fields in the account master data cover a wide variety of information relevant to the accounts and accounts holders: account information, such as account type and account status; demographic information, such as account holders’ age and gender; and financial information, such as credit limits and late pay amounts. Account master data is updated by the bank on a continuous basis.
This case study uses eight attributes: call length, bank representative ID, supervisor ID, customer service center location, original fee, actual fee, sequence number of the account, and number of cards. Most of these attributes, such as call length, annual fee, and output annual fee, are necessary to test the original audit objectives. Other attributes are newly added during the EDA process, such as supervisor number and number of cards. The names, source database, and descriptions of these attributes are listed in Table 1.
Table 1. Description of Attributes Included in This Study.
Attribute Name (Source Database) | Description |
Call length (retention) | The duration of each call in seconds |
Call location (retention) | The location of the customer service center |
Agent number (retention) | ID of the bank representative answering the call |
Supervisor number (retention) | ID of the representative’s supervisor |
Sequential number (retention and account master) | Sequence Number of an account |
Annual fee (retention) | Original annual fees of a credit card |
Output annual fee (retention) | Actual annual fees paid by each client |
Number of cards (account master) | Number of cards associated with each account |
Among these fields, call length, original fees, actual fees, and number of cards are continuous variables. Representative’s ID, supervisor’s ID, client’s ID, account sequential number, and customer service center location are nominal variables. To protect clients’ privacy, the account sequential numbers and clients IDs are encrypted in the data set. The encryption method preserves the integrity of the original data; each original value corresponds to a unique cipher text.
3.2. Data Preprocessing
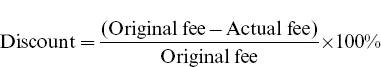
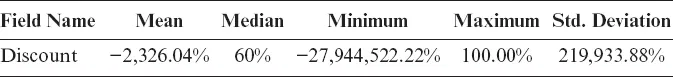
Discounts offered by bank representatives play an important role in the process of analyzing loss of revenue. However, there is no field that directly reflects discounts in the raw retention data. Two existing fields that relate to discounts are original fees before negotiation and actual fees after negotiation. The difference represents the discount, which is needed to conduct EDA. Specifically, the discount is the difference between original fees and actual fees divided by the original fees. The formula used to calculate discounts is:
EDA analyses may require account master data. Therefore, retention data and customer master data need to be joined so that related data elements can be matched. For example, while each client exists only once in the customer master data, each phone call to negotiate discounts creates another item in the retention data set. These many-to-one data sets can be joined based on this relationship. The joining process uses the account sequential number field as it exists in both data sets and is the unique identifier in the Visual Basic for Applications (VBA) data.
3.3. Applied EDA Techniques
In this case study, traditional EDA techniques, such as descriptive statistics, data transformation, and data visualization techniques are mainly used to explore the data. Descriptive statistics used in this study include frequency distribution, summary statistics (mean and standard deviation), and categorical summarization. Data transformation is achieved by the logarithm function. Applied data visualization techniques involve pie charts, bar charts, linear charts, and scatter plots.