![]()
Part One
Investment in the United Kingdom: The Current Environment
![]()
1.1 THE UK ECONOMY AND INVESTMENT ENVIRONMENT
Jonathan Reuvid Legend Business
During the past year the UK economy has consolidated its recovery from the last decade’s recession. With a new majority government pledged to continue the previous coalition government’s policies of deficit reduction, a firm control of public spending, infrastructure investment and a fresh commitment to growth, stability is assured through to 2020.
Nevertheless, there are challenges ahead both from the possible impact of the downturn in China’s economy and more sluggish recovery of some of the UK’s major EU trading partners. At home, productivity improvement is recognized as a prerequisite for sustained economic strength and the government is applying fiscal adjustments and further incentives to assist businesses in achieving this goal.
Securing a broad base from which foreign investments are generated is critical to the UK retaining its position as the leading destination for FDI in Europe. During 2014/15 investments were received from a record number of countries and territories, notably emerging markets of which India became the third largest source of all investments. The effectiveness of the UK offering is being enhanced through UK Trade & Investment (UKTI) joint trade and investment sector teams in order to create more export-led inward investment opportunities.
MACRO-ECONOMIC INDICATORS
Forecasts for 2015/16
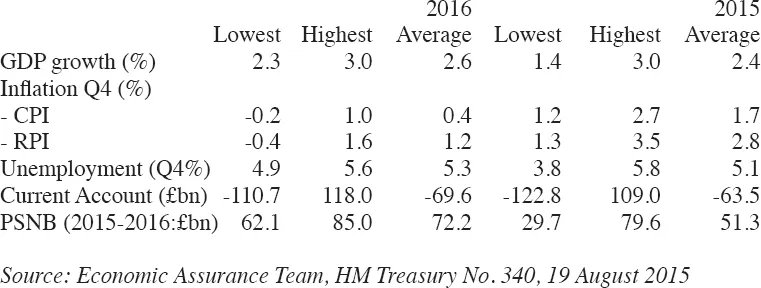
Composite forecasts for the basics of the UK economy published by HM Treasury are highlighted in Table 1.1.1.
Table 1.1.1 Macro-economic indicators August 2015
The highest and lowest and forecasts are extracted and the averages calculated from the forecasts made during the previous month by 22 city banks and investment firms, and 17 non-City research institutions and forecasters including the OECD, IMF, EC, Economist Intelligence Unit (EIU) and Confederation of British Industry (CBI).
Prospects for the UK are compared with those of other major advanced economies and the emerging and developing economies in Table 1.1.2 by reference to recent IMF growth forecasts, indicating a steadily improving outlook for the UK in the near-term, second only to the US among the developed economies.
Table 1.1.2 2016 forecast GDP growth vs 2015
| 2015 | 2016 |
| % | % |
Advanced economies |
UK | 2.4 | 2.7 |
US | 2.5 | 3.0 |
Canada | 1.5 | 2.1 |
Japan | 0.1 | 1.2 |
Germany | 1.6 | 1.7 |
France | 1.2 | 1.5 |
Italy | 0.7 | 1.2 |
Spain | 3.1 | 2.5 |
Euro area | 1.5 | 1.7 |
Emerging and developing economies |
Europe | 2.9 | 2.9 |
Asia | 6.6 | 6.4 |
China | 6.8 | 6.3 |
India | 7.5 | 7.5 |
World | 3.3 | 3.8 |
Source: IMF forecasts June/July 2015
The growth prospects for Asian economies, notably China and India exceed the UK GDP forecasts and underline the renewed focus on these markets for trade and investment.
The UK Population
The population stands at an estimated 64.6 million, with a growth of 491,000 over the previous year and a forecast annual growth rate of 0.7% through to 2021. The population has aged since 2004 with the proportion of those aged 16-64 decreasing marginally from 65% to 64% and those aged 65 and over increasing from 16% to 18% (Source: Office of National Statistics, June 2015).
As of May 2015, 30.98 million were in work, 265,000 more than a year earlier. As of July the jobless rate stands at 5.6% (www.tradingeonomics.com) Applying the international “standardised” measurement, the UK’s rate of unemployment compares favourably with the EU average of 9.7% (source: Eurostat, 2015) although higher than the US (5.3%) and Germany (4.7%).
According to the 2011 census, 83.9% of the population are resident in England, 8.4% in Scotland, 4.9% in Wales and 2.8 % in Northern Ireland. Of those living in England and Wales, 7.5 million (13%) were born abroad of which almost half (3.4 million) held a UK passport.
Some of those born abroad have since become British citizens. Of the 694,000 born in India, 379,000 had taken British citizenship. By contrast, of the 579,000 residents born in Poland, 558,000 remained Polish nationals having acquired the right to live and work in the UK since Poland joined the EU in 2004. The other top 10 countries of birth of UK residents were: Pakistan, Republic of Ireland, Bangladesh, Nigeria, South Africa, US and Jamaica and China. Immigration has risen sharply and continues to rise since the millennium.
UK INWARD INVESTMENT
The UK stock of inward foreign investment is valued at US$1.7 trillion (£1.0 trillion), an increase of more than 9% during 2014 and advanced by almost 50% since 2010, according to the OECD 2015 report. The UK continues to rank third as the largest global recipient of FDI stock after the USA and China and foremost in the EU. In 2014 the UK attracted FDI inflows of $35 billion representing 28% of all capital investment flows into greater Europe against a share of 10% into Russia, 7% into Spain and 5% each into Germany and Poland, while France, Netherlands Ireland, Turkey and Romania scored 4% each. The FT fDi report (2015) records that the UK received FDI for 909 projects in 2014, 8 % more than the previous year and significantly more than Germany (378), Spain (252) and France (237).
As Michael Boyd, Managing Director, Investment, at UK Trade & Investment (UKTI) concludes in his introduction to the UKTI Inward Investment Report 2014/15 “These results show once again that the UK is a world-beater in attracting foreign direct investment.” The Ernst & Young attractiveness survey 2015 confirms that the UK received a record number of new FDI projects (887) excluding mergers and acquisitions in 2014, an increase of 11 per cent over 2013 which raised its market share in Europe to 20.4%, the highest share since 2009. In terms of employment, FDI generated 84,603 new jobs in 2014 (source: UKTI), 12% more than in the previous year, 70 per cent more than in Russia and almost 2.5 times more than in Germany. In addition, FDI activity also safeguarded a further 23,055 UK jobs in 2014.
Sources of FDI
According to the same Ernst & Young report, investor sentiment towards Europe has strengthened and Western Europe is now judged the most attractive region by 50% of investors followed by the US (39%) and China (38%). However, the 2015 AT Kearney FDI Confidence Index continues to rank the US first and China second among the top 10 countries for FDI with the UK now ranked a further place up in third. Analysing the investments of the top 10 countries of origin in 2014, we can see that the UK was the leading destination for US, French and Japanese investors. For most of those countries where Germany or France was the preferred destination, the UK also received significant shares of FDI: China (19%); Netherlands (18%); and Italy (17%).
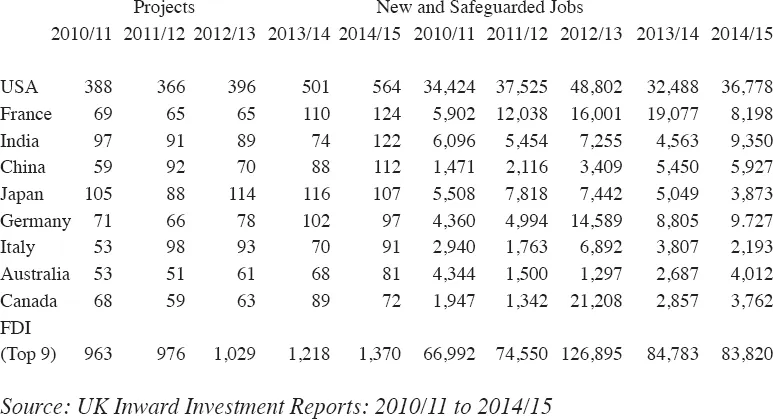
The investment contribution over the past five years of the top 9 geographical sources of FDI towards the total of 1,988 new projects which generated 84,603 new jobs and safeguarding 23,055 jobs in 2014/15 is displayed in Table 1.1.3.
Table 1.1.3 Top nine sources of investment 2010/11 to 2014/15
As in the previous four years, the US remains by far the biggest source of FDI with 564 projects, accounting for 28% of the new project total and 34% of created and safeguarded jobs. This corresponds to the FDI stock figures which also confirm that the USA is the continuous largest source of inward FDI. The two largest European sources of FDI in 2014/15 were France and Germany, together contributing more than 220 projects. However, while France remains in second place, German’s contribution was surpassed by India, China and Japan, in that order, each investing in more than 100 projects. Italy regained its level of 2011/12 and 2012/13 with 91 projects while Australia and Canada reversed their positions with 81 and 72 projects, up and down 19% respectively on their 2013/14 investment activities. Of the 112 Chinese projects, 13 investments originated from Hong Kong.
Overall, the almost 2,000 FDI projects were gained from a record number of more than 70 countries and territories. In addition to the nine sources detailed above, projects were secured from Spain (59), Ireland (51) and Switzerland (42) with 24 projects from the rest of the Americas, 342 from other EMEA countries and 103 from the rest of APAC territories. In addition, UKTI reports that its drive in emerging markets had yielded a combined pipeline of over 500 registered opportunities by mid-year 2015.
COMPOSITION OF INVESTMENT PROJECTS
Inward investment by category
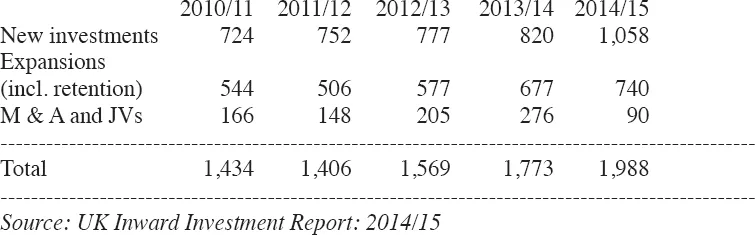
The proportions of 2014/15 FDI recorded between completely new investments, expansions of previous investments and mergers and acquisition (M&As) including joint ventures (JVs) are compared with the proportions of the previous four years in Table 1.1.4 below.
Table 1.1.4 Types of investment
The overall growth rate of 12% in investment projects in 2014/15 more than matched the previous year’s growth of 11%. In 2014/15 growth was driven primarily by new investments, an increase of 238 (29%) in absolute numbers, whereas the primary growth element in 2013/14 was expansions. This year expansions increased in numbers by 67, rather less than the 100 recorded in the previous year while the number of M&A and JV Investments declined by 86 below the level for 2012/13.
Inward Investment by Industry Group and Sector
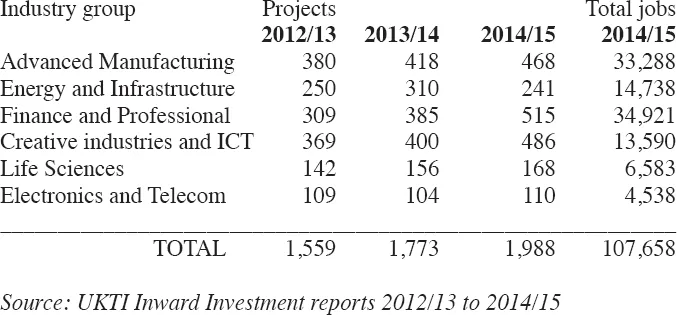
The dispersion of FDI by primary business sector in 2013/2014 and jobs created or safeguarded is detailed in Table 1.1.5; project numbers are compared with 2012/13.
Table 1.1.5 UK inward investment projects by primary industry group
As in the previous two years, FDI in advanced manufacturing delivered 12% more projects than in 2013/14 but 11% less jobs. Foreign investments continue to perform an important role in strengthening many of the key sectors and industries across the UK economy including the advanced manufacturing group in which automotive and advanced engineering (117 projects), aerospace (43 projects) and chemicals (36 projects) sectors are prominent. Almost 17,000 jobs were created or safeguarded in the automotive industry alone.
In 2014/15 financial and professional services together generated both the most projects, 34% more than the previous year, and most jobs (up 61%). Of this total, financial services contributed 222 new investment projects and 11,843 new and safeguarded jobs.
In terms of job creation and safeguarding, the energy and infrastructure sector generated 22% less projects and less than half the number jobs than in 2013/14. However, UKTI secured £10.4 billion in capital investment commitment for infrastructure involving institutional and corporate investors in 30 projects and the creation of 3,000 jobs. The oil and gas sub-sector recorded investments in 48 projects involving 2,961 new and safeguarded jobs.
The creative industries and ICT sector again contributes strongly with project numbers up 21% and jobs created and safeguarded up 12%. Within the sector, creative industries accounted for 124 recorded projects and 2,915 new and safeguarded jobs. The info...