Introduction
Genomic selection is based on the synthesis of statistical and molecular genetics that occurred during the last three decades. In this introductory chapter we will review the landmark breakthroughs that lead to this synthesis. The first section reviews the milestones in the synthesis of Mendelian and quantitative genetics. The next section reviews the early experiments of quantitative trait locus (QTL) detection using morphological and biochemical markers, beginning with Sax’s landmark experiment with beans (Phaseolus vulgaris). The following sections describe the development of DNA-level markers starting with restriction fragment length polymorphisms (RFLPs) to single nucleotide polymorphisms (SNPs) and copy number variations (CNV). The final sections describe QTL detection and marker-assisted selection (MAS) prior to genomic selection.
The Mendelian Theory of Genetics
Modern genetics is usually considered to have started with the rediscovery of Mendel’s paper in 1900. The rediscovery of Mendel’s laws led to a rapid first synthesis of genetics, statistics, and cytology. Boveri (1902) and Sutton (1903), first proposed the “chromosomal theory of inheritance” that the Mendelian factors were located on the chromosomes. Using Drosophila, Morgan (1910) demonstrated that Mendelian genes were linked and could be mapped into linear linkage groups of a number equal to the haploid number of chromosomes. Hardy (1908) and Weinberg (1908) independently derived their famous equation to describe the distribution of genotypes in a segregating population at equilibrium. That is, the frequencies of genotypes for a locus with two alleles with frequencies p and 1 − p will be p2, 2p(1 − p), and (1 − p)2 for homozygotes for p-allele and heterozygotes and homozygotes for the other allele, respectively.
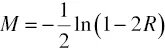
In 1919 Haldane derived a formula to convert recombination frequencies into additive “map units” denoted “Morgans” or “centimorgans,” assuming a random distribution of events of recombination along the chromosome. The Haldane mapping function (Haldane, 1919) is based on the assumption of zero “interference” throughout the genome. That is, all events of recombination are statistically independent. In this case the number of events of recombination in any given chromosomal segment corresponds to a Poisson distribution. The map distance between two genes in Morgans, M, which is a function of the frequency of observed recombination between them, R, is derived as follows:
The Mendelian Basis of Quantitative Variation
Unlike the morphological traits analyzed first by Mendel and then by Morgan, most traits of economic interest in agricultural species display continuous variation, rather than the discrete distribution associated with Mendelian genes. Despite the early synthesis between Mendelian genetics and cytogenetics, there seemed to be no apparent connection between Mendelian genetics on the one hand and quantitative variation and natural selection on the other.
Experiments by Johanssen (1903) with beans demonstrated that environmental factors are a major source of variation in quantitative traits, leading to the conclusion that the phenotype for these traits is not a reliable indicator for the genotype. Yule in 1906 first suggested that continuous variation could be explained by the cumulative action of many Mendelian genes, each with a small effect on the trait. (Many different terminologies have been employed for these genes. I will use the term “QTL” throughout.) Fisher in 1918 demonstrated that segregation of QTL in an outcrossing population would generate correlations between relatives. Payne (1918) demonstrated that the X chromosome from selected lines of Drosophila contains multiple factors, which influenced scutellar bristle number. Thus, by 1920, the basic theory necessary for detection of individual genes affecting quantitative traits was in place.
Detection of QTL with Morphological and Biochemical Markers
In 1923 Sax demonstrated with beans that the effect of an individual locus on a quantitative trait could be isolated through a series of crosses, resulting in randomization of the genetic background with respect to all genes not linked to the genetic markers under observation. Even though all of his markers were morphological seed markers with complete dominance, he was able to show a significant effect on seed weight associated with some of his markers.
During the next 50 years, there were relatively few successful experiments that found marker–QTL linkage in plant and animal populations, and of these even fewer were independently repeated. A major problem was the relatively small size of most experiments. In most cases in which QTL effects were not found, power was too low to find segregating QTL of a reasonable magnitude (Soller et al., 1976).
In 1961 Neimann-Søressen and Robertson proposed a half-sib design for QTL detection in commercial dairy cattle populations. Although the actual results were disappointing, this was the first attempt to detect QTL in an existing segregating population. All previous studies were based on experimental populations produced specifically for QTL detection. This study was also groundbreaking in other aspects. It was the first study to use blood groups rather than morphological markers, and the proposed statistical analyses—a χ2 (chi-squared) test, based on a squared sum of normal distributions, and ANOVA—were also unique. This was the first study that attempted to estimate the power to detect QTL and to consider the problem of multiple comparisons when several traits and markers were analyzed jointly.
Lewontin and Hubby showed in 1966 that electrophoresis could be used to disclose large quantities of naturally occurring enzyme polymorphisms in Drosophila. Almost all enzymes analyzed showed some polymorphism that could be detected by the speed of migration in an electric field. Studies with domestic plant and animal species found that electrophoretic polymorphisms were much less common in agricultural populations. During the 1980s there were a number of QTL detection studies in agricultural plants based on isozymes using crosses between different strains or even species in order to generate sufficient electrophoretic polymorphism (Tanksley et al., 1982; Kahler and Wherhahn, 1986; Edwards et al., 1987; Weller et al., 1988). It was clear, though, that naturally occurring biochemical polymorphisms were insufficient for complete genome analyses in populations of interest.
DNA-Level Markers, 1974–1994
The first detected DNA-level polymorphisms were RFLPs. Grodzicker et al. (1974) first showed that restriction fragment band patterns could be used to detect genetic differences in viruses. Solomon and Bodmer (1979) and Botstein et al. (1980) proposed RFLP as a general source of polymorphism that could be used for genetic mapping. Although RFLPs are diallelic, initial theoretical studies demonstrated that they might be present throughout the genome. Beckmann and Soller (1983) proposed using RFLP for detection and mapping of QTL. The first genome-wide scan for QTL using RFLP was performed on tomatoes by Paterson et al. (1988). In animal species, however, RFLP markers were homozygous in most individuals and therefore have not been as useful for QTL mapping.
A major breakthrough came at the end of the decade with the discovery of DNA microsatellites. Mullis et al. (1986) proposed the “polymerase chain reaction” (PCR) to specifically amplify any particular short DNA sequence. Using the PCR, large enough quantities of DNA could be generated so that standard analytical methods could be applied to detect polymorphisms consisting of only a single nucleotide. Since the 1960s, it has been known that the DNA of higher organisms contains extensive repetitive sequences. In 1989 three laboratories independently found that short sequences of repetitive DNA were highly polymorphic with respect to the number of repeats of the repeat unit (Litt and Luty, 1989; Tautz, 1989; Weber and May, 1989). The most common of these repeat sequences was poly(TG), which was found to be very prevalent in all higher species. These sequences were denoted “simple sequence repeats” (SSR) or “DNA microsatellites.”
Microsatellites were prevalent throughout all genomes of interest. Nearly all poly(TG) sites were polymorphic, even within commercial animal populations. These markers, unlike most morphological markers, were by definition “codominant.” That is, the heterozygote genotype could be distinguished from either homozygote. Furthermore, microsatellites were nearly always polyallelic. That is, more than two alleles were present in the population. Thus, most individuals were heterozygous. Relatively dense genetic maps based on microsatellites were generated nearly in all agricultural species (e.g., Ihara et al., 2004), and these markers were also used to detect and map segregating QTL. The weaknesses of microsatellites are twofold: First their distribution throughout the genome is not sufficiently dense for determination of causative polymorphisms responsible for observed QTL. (The causative polymorphisms will be denoted “quantitative trait nucleotides” (QTN).) Second, due to the repeat structure of microsatellites, PCR amplification was generally not exact, and “stutter bands” with varying numbers of the repeat unit were generated. Various rules were developed to estimate the actual genotype from the observed PCR product, but the analysis could not be fully automated. A technician still had to review each individual genotype, and error rates in genotype determination were in the range of 1–5%.
DNA-Level Markers Since 1995: SNPs and CNV
Since 2000 “SNPs” (reviewed by Brookes (1999)) have supplanted microsatellites as the marker of choice for genetic analysis. An SNP is generally defined as a DNA base pair location at which the frequency of the most common base pair is lower than 99%. Unlike microsatellites, which usually have multiple alleles, SNPs are generally biallelic, but are much more prevalent throughout the genome, with an estimated frequency of one SNP per 300–500 base pairs. In human populations differences in the base pair sequence of any two randomly chosen individuals occur at a frequency of approximately one per 1000 kb (Brookes, 1999). Thus, SNPs can be found in genomic regions that are microsatellite poor. SNPs are apparently more stable than microsatellites, with lower frequencies of mutation. Beginning in 2005, methods were developed for automated scoring of first thousands and then hundreds of thousands of microsatellites per individual. Genotyping error rates are in the range of 0.05–0.01% with “BeadChip”...