Understanding Statistical Error
eBook - ePub

Understanding Statistical Error

A Primer for Biologists

Marek Gierlinski

  1. English
  2. ePUB (mobile friendly)
  3. Available on iOS & Android
eBook - ePub

Understanding Statistical Error

A Primer for Biologists

Marek Gierlinski

Book details
Book preview
Table of contents
Citations

About This Book

This accessible introductory textbook provides a straightforward, practical explanation of how statistical analysis and error measurements should be applied in biological research.

Understanding Statistical Error - A Primer for Biologists:

  • Introduces the essential topic of error analysis to biologists
  • Contains mathematics at a level that all biologists can grasp
  • Presents the formulas required to calculate each confidence interval for use in practice
  • Is based on a successful series of lectures from the author's established course

Assuming no prior knowledge of statistics, this book covers the central topics needed for efficient data analysis, ranging from probability distributions, statistical estimators, confidence intervals, error propagation and uncertainties in linear regression, to advice on how to use error bars in graphs properly. Using simple mathematics, all these topics are carefully explained and illustrated with figures and worked examples. The emphasis throughout is on visual representation and on helping the reader to approach the analysis of experimental data with confidence.

This useful guide explains how to evaluate uncertainties of key parameters, such as the mean, median, proportion and correlation coefficient. Crucially, the reader will also learn why confidence intervals are important and how they compare against other measures of uncertainty.

Understanding Statistical Error - A Primer for Biologists can be used both by students and researchers to deepen their knowledge and find practical formulae to carry out error analysis calculations. It is a valuable guide for students, experimental biologists and professional researchers in biology, biostatistics, computational biology, cell and molecular biology, ecology, biological chemistry, drug discovery, biophysics, as well as wider subjects within life sciences and any field where error analysis is required.

Frequently asked questions

How do I cancel my subscription?
Simply head over to the account section in settings and click on “Cancel Subscription” - it’s as simple as that. After you cancel, your membership will stay active for the remainder of the time you’ve paid for. Learn more here.
Can/how do I download books?
At the moment all of our mobile-responsive ePub books are available to download via the app. Most of our PDFs are also available to download and we're working on making the final remaining ones downloadable now. Learn more here.
What is the difference between the pricing plans?
Both plans give you full access to the library and all of Perlego’s features. The only differences are the price and subscription period: With the annual plan you’ll save around 30% compared to 12 months on the monthly plan.
What is Perlego?
We are an online textbook subscription service, where you can get access to an entire online library for less than the price of a single book per month. With over 1 million books across 1000+ topics, we’ve got you covered! Learn more here.
Do you support text-to-speech?
Look out for the read-aloud symbol on your next book to see if you can listen to it. The read-aloud tool reads text aloud for you, highlighting the text as it is being read. You can pause it, speed it up and slow it down. Learn more here.
Is Understanding Statistical Error an online PDF/ePUB?
Yes, you can access Understanding Statistical Error by Marek Gierlinski in PDF and/or ePUB format, as well as other popular books in Medicina & Bioestadística. We have over one million books available in our catalogue for you to explore.

Information

Year
2015
ISBN
9781119106890
Edition
1

Chapter 1
Why do we need to evaluate errors?

A measurement without error is meaningless.
—My physics teachers
Think of a number, a measurement from an experiment. We can determine in a microarray experiment, for example, levels of gene expression following a treatment of interest. Let us assume the resulting number is 19,086. It represents the intensity from a gene probe expressed in some arbitrary units. This number by itself doesn't tell us much. We need to compare it with a result from the control sample. Let's say the control gives an intensity of 39,361 for the same gene.
Looking at these two numbers, you might conclude that there is a twofold change in gene expression, and we all know that a twofold change is compelling. So, the gene of interest is suppressed under the treatment. Excellent! Time to publish the results.
But not so fast. The problem is that each measurement has an inherent uncertainty, or error. There is a limit as to how sure we can be that the experimental result is reflecting the true parameter we are trying to assess, in this case the level of gene expression. In some types of experiments, uncertainties can be high, so having two ‘naked’ numbers without knowing how robust they are doesn't mean the observed twofold change between our two conditions has any significance.
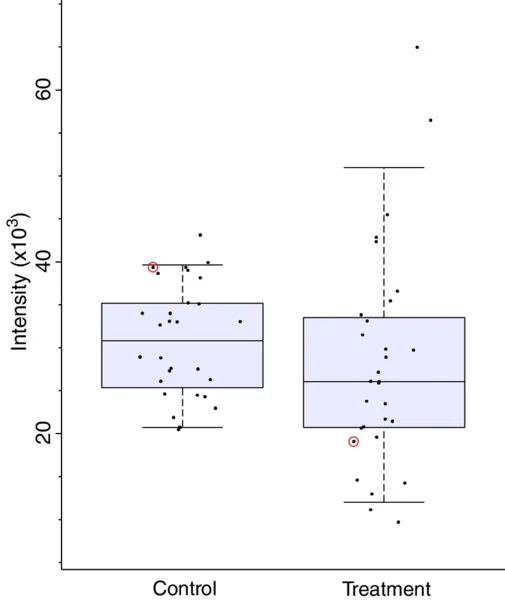
Now imagine you have a lot of money and a lot of time, and you can repeat your experiment (both control and treatment) 30 times. Each time, you measure expression of the same gene. The result is shown in Figure 1.1.
Image described by caption.
Figure 1.1 Control (left) and treatment (right) samples from an imaginary microarray experiment. Each measurement was done in 30 replicates. Clouds of points represent individual measurements; boxes encompass data between the 25th and 75th percentiles; whiskers span between the 5th and 95th percentiles. The line in the middle represents the sample median. Although the two initial measurements (circled points) differ by factor two, there is no statistically significant difference between the samples.
It turns out that repeated measurements of the same quantity reveal a huge scatter in the values obtained, with the results for control and treatment largely overlapping. This is not atypical in biology. You can aggregate your repeated results (a sample) and represent them by calculating the sample mean and standard error of the mean. These results are (30.7 ± 1.2) × 103 and (28.3 ± 2.3) × 103 for control and treatment, respectively. Now we have not only numbers, which come from repeated experiments, but also errors that represent the uncertainties of our measurements. These errors overlap, and a proper statistical test (e.g. a t-test) shows that there is no statistically significant difference between the mean value of the treatment and control (p = 0.2). The previous simplistic conclusion that the treatment changed the level of gene expression has, therefore, been shown to be incorrect.
A measurement without quoted error is meaningless.
This little example demonstrates why we need errors and error bars. In this book, I will explain how to evaluate errors the easy way. I will begin with basic concepts of probability distributions.

Chapter 2
Probability distributions

Misunderstanding of probability may be the greatest of all impediments to scientific literacy.
—Stephen Jay Gould
Consider an experiment in which we determine the number of viable bacteria in a sample. To do this, we can use a simple technique of dilution plating. The sample is diluted in five consecutive steps, and each time the concentration is reduced 10-fold. After the final step, we achieve the dilution of 10− 5. The diluted sample is then spread on a Petri dish and cultured in conditions appropriate for the bacteria. Each colony on the plate corresponds to one bacterium in the diluted sample. From this, we can estimate the number of bacteria in the original, undiluted sample.
Now, think of exactly the same experiment, repeated six times under the same conditions. Let us assume that in these six replicates, we found the following numbers of bacterial colonies: 5, 3, 3, 7, 3 and 9. What can we say about these results?
We notice that replicated experiments give different results. This is an obvious thing for an experimental biologist, but can we express it in more strict, mathematical terms? Well, we can interpret these counts as realizations of a random variable. But not just any completely random variable. This variable would follow a certain law, a Poisson law in this case. We can estimate and theoretically predict its probability distribution. We can use this knowledge to predict future results from similar experiments. We can also estimate the uncertainty, or error, of each result.
Firstly, I'm going to introduce the concept of a random variable and a probability distribution. These two are very closely related. Later in this chapter, I will show examples of a few important probability distributions, without which it would be difficult to understand error analy...

Table of contents

Citation styles for Understanding Statistical Error

APA 6 Citation

Gierlinski, M. (2015). Understanding Statistical Error (1st ed.). Wiley. Retrieved from https://www.perlego.com/book/991335/understanding-statistical-error-a-primer-for-biologists-pdf (Original work published 2015)

Chicago Citation

Gierlinski, Marek. (2015) 2015. Understanding Statistical Error. 1st ed. Wiley. https://www.perlego.com/book/991335/understanding-statistical-error-a-primer-for-biologists-pdf.

Harvard Citation

Gierlinski, M. (2015) Understanding Statistical Error. 1st edn. Wiley. Available at: https://www.perlego.com/book/991335/understanding-statistical-error-a-primer-for-biologists-pdf (Accessed: 14 October 2022).

MLA 7 Citation

Gierlinski, Marek. Understanding Statistical Error. 1st ed. Wiley, 2015. Web. 14 Oct. 2022.