This comprehensive book deals primarily with reflection seismic data in the hydrocarbon industry. It brings together seismic examples from North and South America, Africa, Europe, Asia and Australia and features contributions from eleven international authors who are experts in their field. It provides structural geological examples with full-color illustrations and explanations so that students and industry professionals can get a better understanding of what they are being taught. It also shows seismic images in black and white print and covers compression related structures.
Representing a compilation of examples for different types of geological structures, Atlas of Structural Geological Interpretation from Seismic Images is a quick guide to finding analogous structures. It provides extensive coverage of seismic expression of different geological structures, faults, folds, mobile substrates (shale and salt), tectonic and regional structures, and common pitfalls in interpretation. The book also includes an un-interpreted seismic section for every interpreted section so that readers can feel free to draw their own conclusion as per their conceptualization.
Provides authoritative source of methodologies for seismic interpretation
Indicates sources of uncertainty and give alternative interpretations
Directly benefits those working in petroleum industries
Includes case studies from a variety of tectonic regimes
Atlas of Structural Geological Interpretation from Seismic Images is primarily designed for graduate students in Earth Sciences, researchers, and new entrants in industry who are interested in seismic interpretation.
Trusted by 375,005 students
Access to over 1.5 million titles for a fair monthly price.
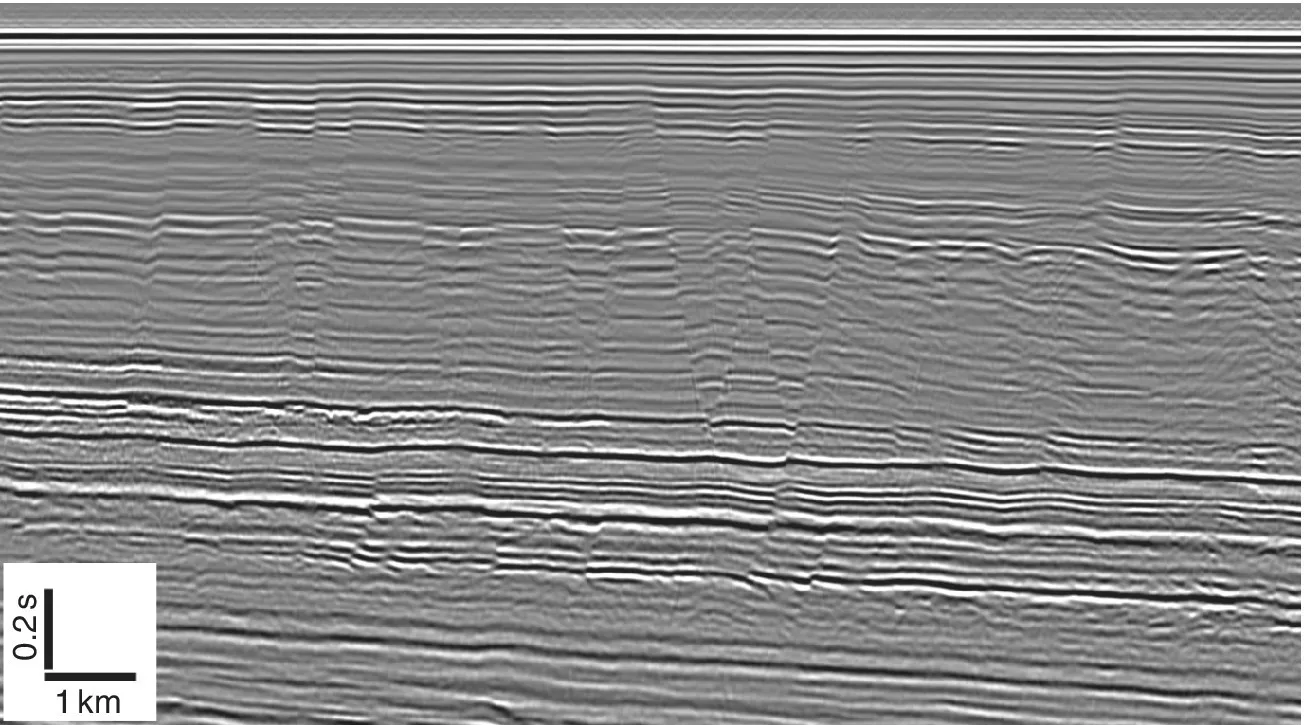
Whenever a reflection seismic section is mentioned, something similar to Figure 1.1 comes to mind. The process leading to the generation of such a section is briefly discussed in this chapter. There is a large volume of literature detailing all the processes and their variations (e.g., Sheriff and Geldart, 1995; Yilmaz, 2001; Liner, 2004; Ashcroft, 2011; Herron and Latimer, 2011; Onajite, 2014). Only a brief account is given here to build the platform for the following chapters.
Figure 1.1 A seismic section showing reflections from sedimentary boundaries.
Seismic data courtesy Reliance Industries Ltd. Reproduced with permission from the Directorate General of Hydrocarbons (DGH), India.
Seismic waves propagate through the Earth at velocities that depend on the acoustic impedance and density of the medium through which they travel. The acoustic impedance, Z, is expressed by (Liner, 2004):
(1.1)
where V is the seismic wave velocity and ρ is the rock density. If the rock varies in density in several directions, one can work with the “effective density” deduced in Mukherjee (2017, 2018, in press).
When a seismic wave propagating through the Earth encounters a boundary between two materials of different acoustic impedances, a part of the energy reflects off the interface while the remainder refracts through it. Seismic reflection prospecting involves generating seismic waves at the surface, which propagate into the subsurface, and capture the reflected wavefronts from the different interfaces while propagating. At each layer most of the energy is transmitted or refracted and a part reflects back (Sheriff and Geldart, 1995; Yilmaz, 2001; Liner, 2004; Ashcroft, 2011; Herron and Latimer, 2011; Onajite, 2014).
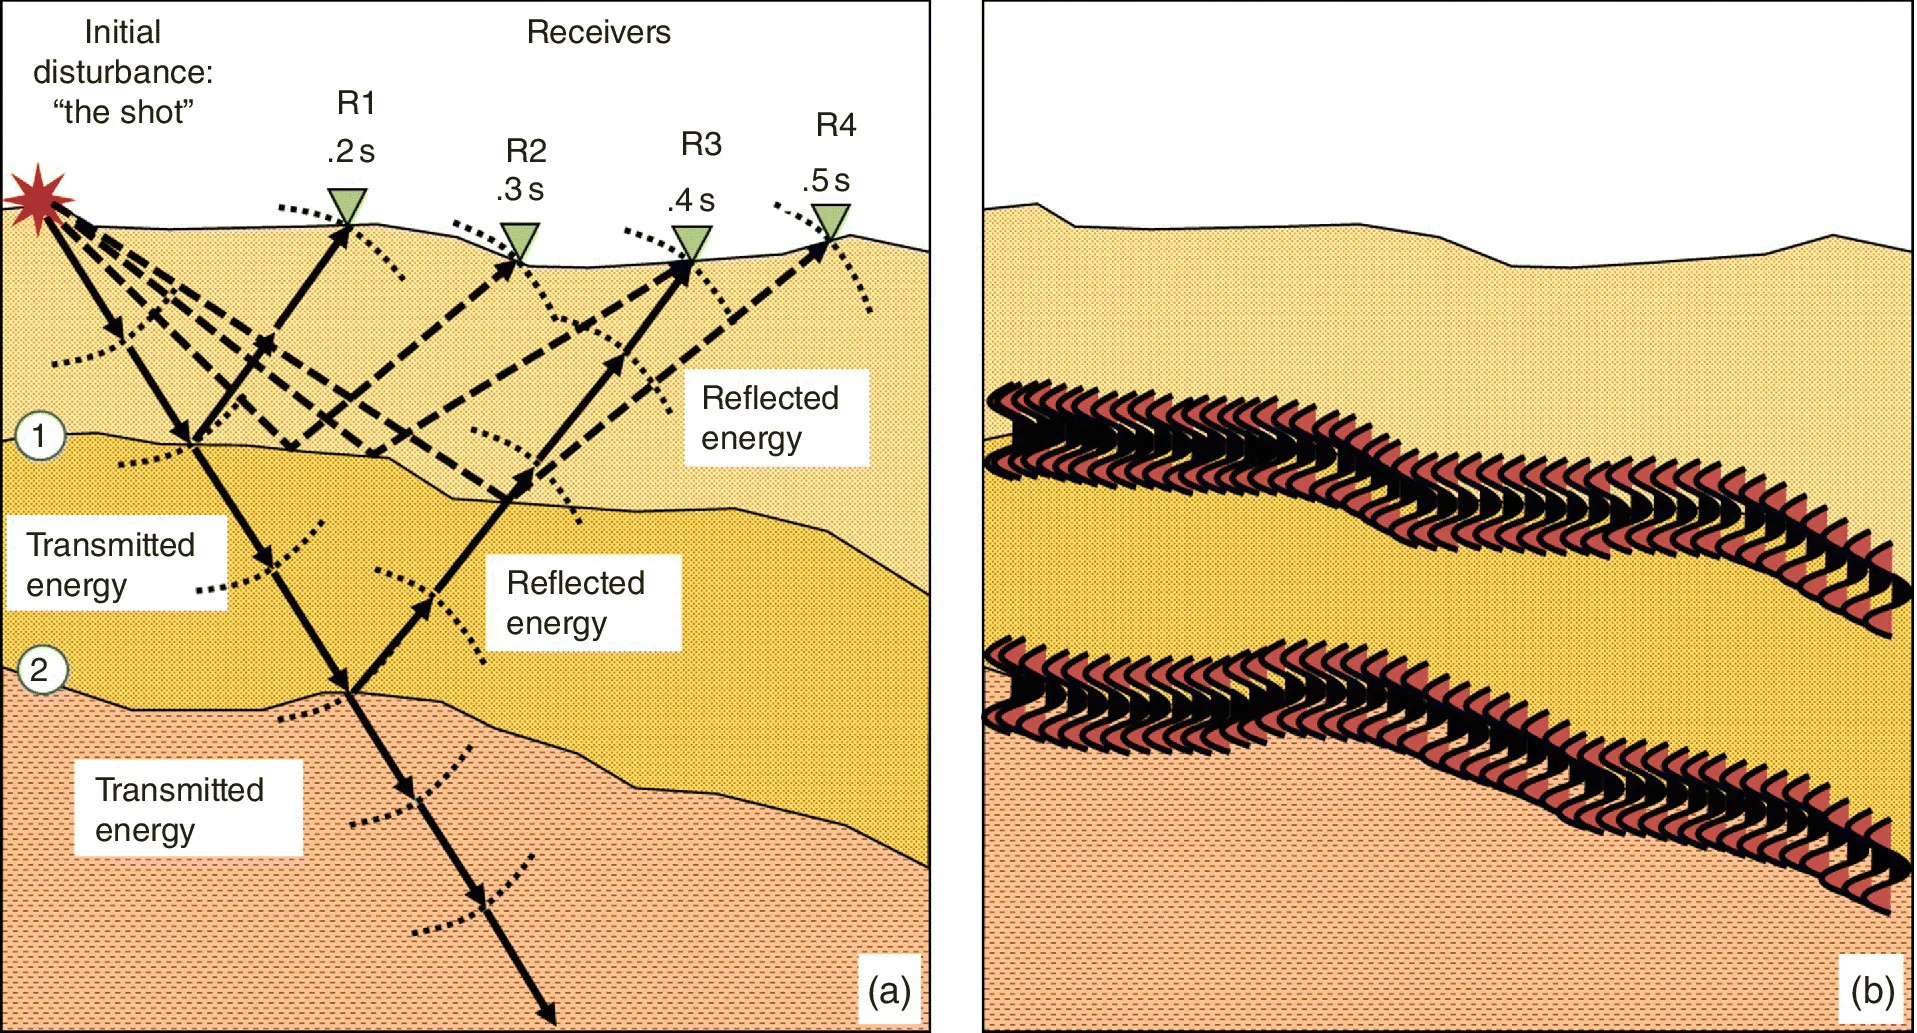
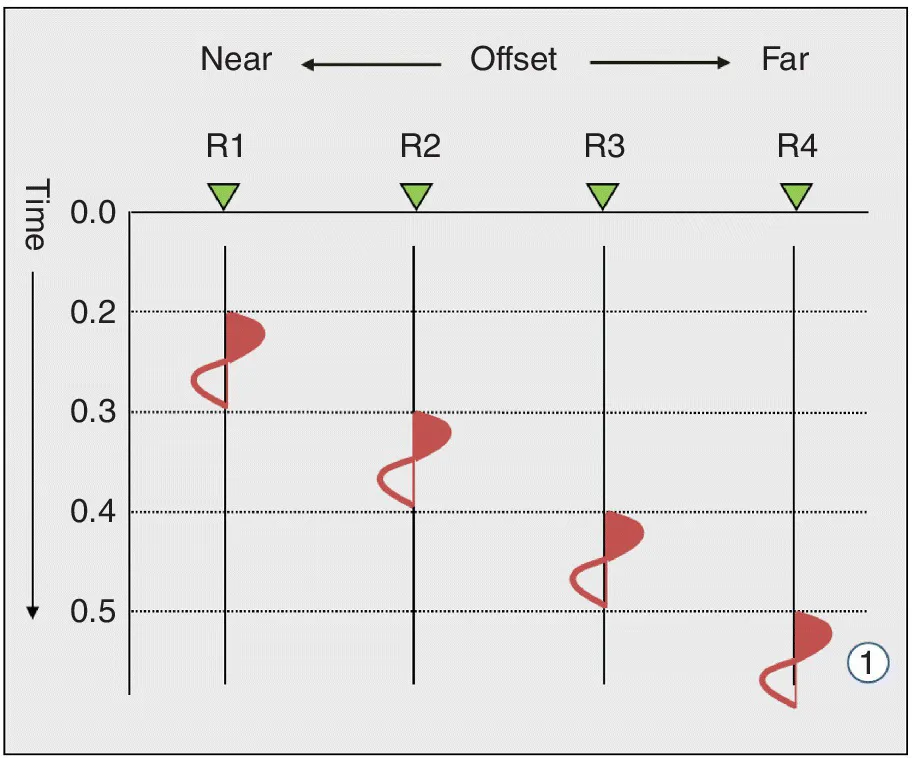
To generate the disturbance, a ‘shot’ or a vibration is made on the sea surface or on Earth’s surface in onland. As the wave propagates into subsurface, each layer reflects the wave at multiple incidence angles and these reflected waves are measured at the surface by receivers, which are hydrophones on water and geophones on land (Figure 1.2). The distance between the source and the receiver is termed the ‘offset’. The data from receivers near the source are called ‘near offset’ and those far away as ‘far offset’. The near receivers receive the reflected signal quicker than those further away from the source, so the response of the same boundary will appear progressively later (Figure 1.3).
Figure 1.2 (a) Schematic diagram showing layout of transmitted and reflected energy from the shot point and to the individual receivers. At every boundary, a part of the energy is transmitted and another part is reflected. The latter reach the receivers at the surface. Note there are two reflectors, numbered (1) and (2). Rn: receiver number; (b) shows the corresponding simplified seismic wriggle traces.
Figure 1.3 Schematic seismic response of reflector (1) on the receivers as shown in Figure 1.1.
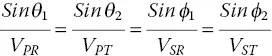
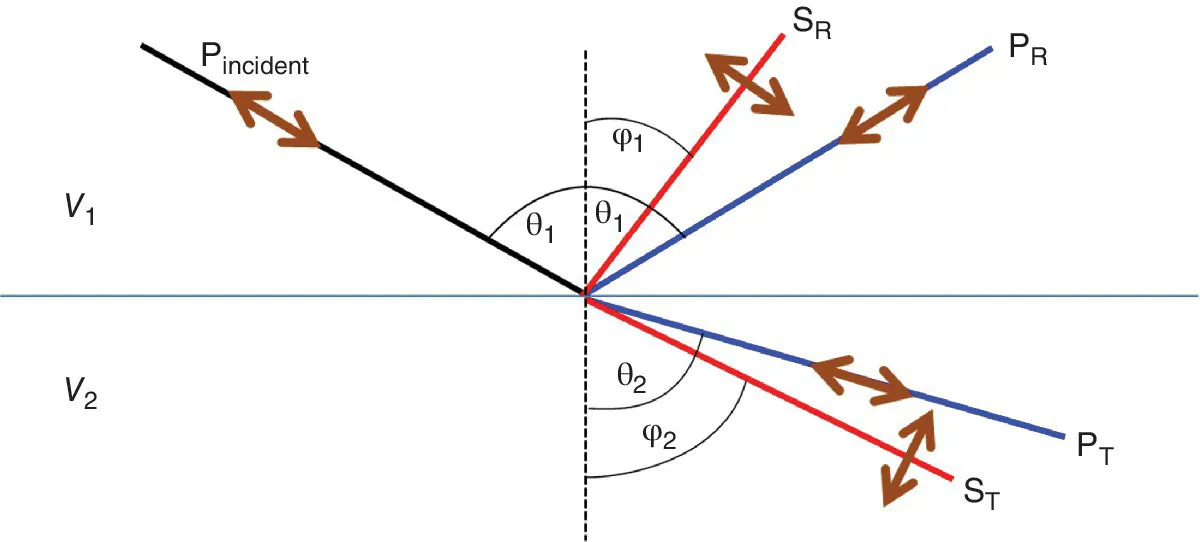
There are two types of seismic waves: (i) P‐waves (longitudinal /compressional /body waves), where the particle motion is parallel to the direction of wave propagation, and (ii) S‐waves (shear /transverse waves), where particles move perpendicular to the wave propagation direction. P‐waves convert into S‐waves and vice versa when they transmit or reflect across a boundary, where there is a phase change i.e. solid to liquid/gas or liquid/gas to solid. Pore spaces have liquid/gas and thus this conversion is very common. Both P and S waves follow Snell’s law of reflection and refraction (Yilmaz, 2001). The angle of incidence equals the angle of reflection; the incident ray, the reflected ray, and the normal to the plane of incidence are co‐planar (Figure 1.4). The refracted seismic waves also follow Snell’s law, which states:
(1.2)
where θ1 is the angle of incidence, VPR the velocity of reflected P‐wave, θ2 the angle of transmitted P‐wave, VPT the velocity of transmitted P‐wave, ϕ1 the angle of the reflected S‐wave, VSR the velocity of the reflected S‐ (converted from P‐) wave, ϕ2 the angle of the transmitted S‐wave and VST the velocity of the transmitted S‐wave.
Figure 1.4 Schematic diagram showing mode conversion of incident P wave in P‐ and S‐waves at a boundary of two lithologies with different velocities V1 and V2. The refracted (transmitted) waves follow Snell’s law. SR: Reflected mode converted S‐wave; PR: reflected P‐wave; ST: Transmitted mode converted S‐wave; PT: transmitted P‐wave.
1.2 Seismic Data Acquisition
Earth’s interior can be imaged by reflection seismic data much lik...
Table of contents
Cover
Title Page
Table of Contents
Contributors
Preface
Acknowledgements
1 Introduction to Seismic Data
2 Seismic Structural Analysis
Part I: Faults
Part II: Folds
Part III: Mobile Substrates
Part IV: Tectonic/Regional Structures
Index
End User License Agreement
Frequently asked questions
Yes, you can cancel anytime from the Subscription tab in your account settings on the Perlego website. Your subscription will stay active until the end of your current billing period. Learn how to cancel your subscription
No, books cannot be downloaded as external files, such as PDFs, for use outside of Perlego. However, you can download books within the Perlego app for offline reading on mobile or tablet. Learn how to download books offline
Perlego offers two plans: Essential and Complete
Essential is ideal for learners and professionals who enjoy exploring a wide range of subjects. Access the Essential Library with 800,000+ trusted titles and best-sellers across business, personal growth, and the humanities. Includes unlimited reading time and Standard Read Aloud voice.
Complete: Perfect for advanced learners and researchers needing full, unrestricted access. Unlock 1.5M+ books across hundreds of subjects, including academic and specialized titles. The Complete Plan also includes advanced features like Premium Read Aloud and Research Assistant.
Both plans are available with monthly, semester, or annual billing cycles.
We are an online textbook subscription service, where you can get access to an entire online library for less than the price of a single book per month. With over 1.5 million books across 990+ topics, we’ve got you covered! Learn about our mission
Look out for the read-aloud symbol on your next book to see if you can listen to it. The read-aloud tool reads text aloud for you, highlighting the text as it is being read. You can pause it, speed it up and slow it down. Learn more about Read Aloud
Yes! You can use the Perlego app on both iOS and Android devices to read anytime, anywhere — even offline. Perfect for commutes or when you’re on the go. Please note we cannot support devices running on iOS 13 and Android 7 or earlier. Learn more about using the app
Yes, you can access Atlas of Structural Geological Interpretation from Seismic Images by Achyuta Ayan Misra, Soumyajit Mukherjee, Achyuta Ayan Misra,Soumyajit Mukherjee in PDF and/or ePUB format, as well as other popular books in Sciences physiques & Géophysique. We have over 1.5 million books available in our catalogue for you to explore.