![]()
1
Introduction to Blood Science
Learning Objectives
After studying this chapter, you should be able to:
- explain key aspects of blood science;
- understand the role of blood science in modern pathology;
- describe the role of blood science in the wider provision of healthcare;
- outline the overlap between different areas of blood science.
In this chapter, we will introduce you to blood science – not only the study of blood, but also how the subject relates with other disciplines in pathology. You will also get a feel for blood science in the wider aspect of healthcare.
1.1 What is Blood Science?
Put simply, it is the study of blood. However, as with many questions, a short answer is often inadequate, and this is no exception. Blood itself is a dynamic and crucial fluid providing transport and many regulatory functions and that interfaces with all organs and tissues. As such, it has a very important role in ensuring adequate whole-body physiology and homeostasis. It follows that adverse changes to the blood will have numerous consequences, many of which are serious and life-threatening.
Blood itself is water which carries certain cells and in which are dissolved many ions and molecules. These cells are required for the transport of oxygen, in defence against microbial attack and in regulating the balance between clotting (thrombosis) and bleeding (haemorrhage). The blood is also an important distributor of body heat. The blood also carries nutrients from the intestines to the cells and tissues of the body. Once these nutrients (and oxygen) have been consumed, the blood transports the waste products of metabolism to the lungs and kidneys, from where they are removed (i.e. they are excreted). In some particular diseases and conditions (such as diabetes, myeloma and renal disease), the investigation of urine can be valuable. Although clearly not blood, blood scientists will perform and comment on the analysis of this fluid.
An Historical Perspective
From the early 19th century, little was known about the make-up of blood, and blood cells in particular, until a way could be found of stopping it clotting once outside the body. Thus, the development of anticoagulants was an important breakthrough. Once this was achieved, it became possible to separate intact blood cells from plasma. This led to the discovery of the differences between serum and plasma, the former obtained from clotted blood.
As the Victorian age progressed, chemists were refining old tests and discovering new ones, and so initiated the development of modern biochemistry. However, the most well-developed disciplines were (what we now call) microbiology and histology. The former was built on study of diseases such as cholera and tuberculosis, and the germ and antiseptic theories of Koch, Lister and others. Histology was benefiting from the development of dyes, enabling the identification of different substances within tissues of the body.
The first organization dedicated to non-medical laboratory workers, the Pathological and Bacteriological Laboratory Assistants Association, the forerunner of today's Institute of Biomedical Science (IBMS), was founded in 1912. Members of this group include biomedical scientists and clinical scientists. Other professional bodies for laboratory workers include the Association for Clinical Biochemistry, founded in 1953.
Further developments in biomedical science during the remainder of the last century saw the emergence of four disciplines within pathology: biochemistry (also known as clinical chemistry), haematology, histology and microbiology (the latter having evolved from bacteriology in recognition of the role of viruses in human disease). Immunology appeared as a discipline in its own right in the 1970s, followed in the last decades by genetics (possibly also known as molecular biology, or more correctly as molecular genetics).
Therefore, biomedical science has been evolving over the last 200 years, driven by advances in science and technology. This evolution has seen the merging of several of these disciplines (bacteriology and virology into microbiology) and the development of new ones. This principle has also been rolled out for other scientists, such as cardiac physiologists, audiologists and medical physicists. Biomedical sciences (which may also be known as the life sciences), encompassing all those working in modern pathology laboratories, may be classified in to three groups: infection sciences, cellular sciences and blood science (Table 1.1).
Table 1.1 The biomedical or life sciences
| Infection sciences |
| Bacteriology, epidemiology and public health, molecular pathology, virology |
| Cellular sciences |
| Cytopathology, genetics, histopathology, reproductive sciences |
| Blood science |
| Biochemistry, haematology, blood transfusion, immunology, molecular genetics |
Therefore, blood science (in common with infection science and cellular science) is simply another step in the development of a particular part of pathology. However, blood science is not simply a group of disciplines thrown together. Haematology and blood transfusion are sisters, and have historically grown up together over the decades. Being based around the functions of certain cells in the blood (leukocytes), immunology is effectively a ‘daughter’ subdivision of haematology.
The merger of biochemistry with haematology, blood transfusion and immunology at first seems strange. However, all take as their source material blood in special blood tubes called vacutainers, some of which have anticoagulants to stop the blood from clotting. Furthermore, to some extent, many tests in each of the four disciplines are amenable to measurement in batches by autoanalysers. As we shall see, many diseases call on both haematology and biochemistry, and often immunology. The serious consequences of many diseases may call for the transfusion of red blood cells or proteins to help the blood to clot. The inclusion of genetics in blood sciences comes from the fact that many diseases have a genetic component, such as the bleeding condition haemophilia, and the cancers leukaemia and lymphoma.
The Reference Range
The function of the laboratory is to provide the practitioner investigating or treating the patient with useful information. This information is almost always numerical; and if so, the particular numbers need to be compared with a range of other numbers to provide the practitioner with an idea of the extent to which a particular result is of concern. This is the set of numbers that we refer to, and hence the term ‘reference range’. We prefer this name to alternatives such as ‘normal range’ or ‘target range'.
The expression ‘normal range’ is inadequate simply because a result that is normal (i.e. is present in a lot of individuals) in a population does not necessarily imply it is desirable. A good example of this is low haemoglobin that may be endemic in some parts of the world, possibly because of malnutrition, genetics and parasites – none of which we would consider healthy. In addition, merely because someone appears healthy (i.e. are asymptomatic), it does not automatically follow that their blood result is satisfactory, and vice versa. Similarly, ‘target range’ is not fully appropriate as it implies a level of a result that we are trying to achieve – this may never be possible in some individuals, resulting in disappointment and a sense of failure. However, there are cases where a target is a useful objective.
It is also worthwhile discussing where ‘normal values’ come from. Who is normal? Many people have un-suspected asymptomatic disease that may well impact on blood science. In the past, results from blood donors were considered to be representative of being ‘normal’, but we now recognize the shortcoming in this definition as blood donors are in fact highly motivated and healthy individuals who are, therefore, on the whole, ‘healthier’ than the general population.
Individuals who are free from disease are often described as being ‘normal’. In a medical setting, someone who is not complaining about any particular condition (such as chest pain) is said to be asymptomatic. This is not to say that person is free of disease, simply that it is not so bad that it impacts on their lifestyle. It is important to recognize that normality does not always indicate health, but is merely an indication of the frequency of a given condition in a defined population. Some diseases occur with such frequency in the population that they might be considered to be ‘normal’, such as dental caries. A further example of this is a high level of serum cholesterol, which is asymptomatic, but which predicts, and is a contributor to, cardiovascular disease.
The Normal Distribution
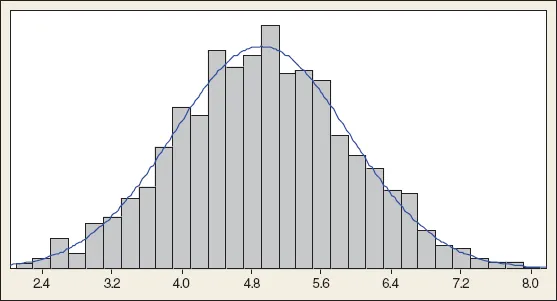
If we examine the distribution of an indicator of health, for example the level of serum cholesterol in a population (Figure 1.1), we can see that it follows a symmetrical bell-shaped curve. Most of the data are in the middle; the result that is present at the greatest frequency (the tallest ‘tower’, which represents the number of people with that result) is about 4.9 mmol/L. Indeed, the average value (known as the mean by statisticians) is 4.9066, which we happily round down to 4.9. This shape has several names, one being the normal distribution. It represents a way we can visualize the spread of values of a particular index in a population. The distribution is called ‘normal’ because most sets of data (height, weight, serum sodium, haemoglobin, numbers of hairs on the head) take this distribution – it does not make any statement about what is normal or abnormal about the data itself. This type of distribution is also often described as ‘bell shaped’.
A close inspection of the distribution in Figure 1.1 shows a small number of low values (on the left, about 2 mmol/L) and an equal number of high values (on the right, about 8 mmol/L). So although the data set ranges from 2 to 8 mmol/L, most values are in the middle, between say 4.2 and 5.6 mmol/L. We can use a mathematical expression to be more precise about this spread, which we call the standard deviation (SD), which is 1 mmol/L. The importance of the SD is that the mean plus or minus two SDs should include 95% of the results, which is 2.9–6.9 mmol/L. It follows that 5% of the results are outside this range.
A common error is to assume that just because someone's result is above or below this ‘magical’ range of mean plus or minus two SDs this automatically implies this result is abnormal. This assumption is incorrect. The definition of normal o...