PROSE Award Finalist 2019
Association of American Publishers Award for Professional and Scholarly Excellence
As a follow up to his widely acclaimed Sustainable Urbanism, this new book from author Douglas Farr embraces the idea that the humanitarian, population, and climate crises are three facets of one interrelated human existential challenge, one with impossibly short deadlines. The vision of Sustainable Nation is to accelerate the pace of progress of human civilization to create an equitable and sustainable world. The core strategy of Sustainable Nation is the perfection of the design and governance of all neighborhoods to make them unique exemplars of community and sustainability. The tools to achieve this vision are more than 70 patterns for rebellious change written by industry leaders of thought and practice. Each pattern represents an aspirational, future-oriented ideal for a key aspect of a neighborhood. At once an urgent call to action and a guidebook for change, Sustainable Nation is an essential resource for urban designers, planners, and architects.
- English
- ePUB (mobile friendly)
- Available on iOS & Android
eBook - ePub
About this book
Trusted by 375,005 students
Access to over 1.5 million titles for a fair monthly price.
Study more efficiently using our study tools.
Information
Part One
Our Default World
Fearful
“You cannot hope to build a better world without improving the individuals. To that end, each of us must work for his own improvement, and at the same time share a general responsibility for all humanity, our particular duty being to aid those to whom we think we can be most useful.”—Marie Curie1
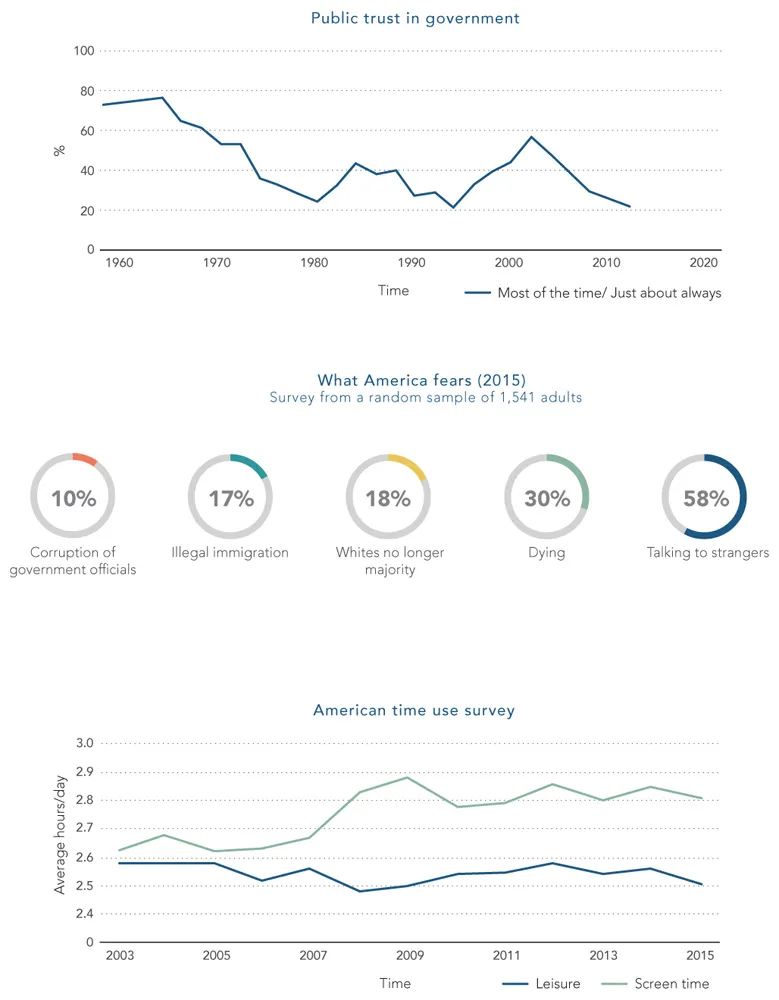
This chapter provides the starting point for Sustainable Nation: a distilled, but not simplified, snapshot of the issues and opportunities the world and the country now face. Using the tight editorial focus of Sustainable Nation to filter our now-daily information overload, this chapter summarizes and frames the data and emotions of many of today's biggest issues in just 22 pages.
The exhibits are organized into global and national threats, barriers, and progress, and grow in relevance and emotional impact with each additional spread. The findings provide a remarkably complete picture of the threats we face, the barriers to overcoming them, and our progress to date. These overlapping and contradictory findings fight one another for primacy and urgency, putting one's mind on high alert in search of productive next steps.
The Tocqueville Effect: Social frustration increases as social conditions improve.
One nondata anomaly bears highlighting: although the world is far from perfect, there is no better time to be alive than today. Incredible progress has been made on seemingly unsolvable global problems such as poverty, disease, and even climate change. Despite this progress (some would say because of our progress), we are less satisfied with where we stand. All of this points to the importance of individuals coming to terms with and understanding where we are—not as a record of deficiencies, but as the dynamic starting point for all that follows.
Global Threats to People and
Planet Merit Our Empathy
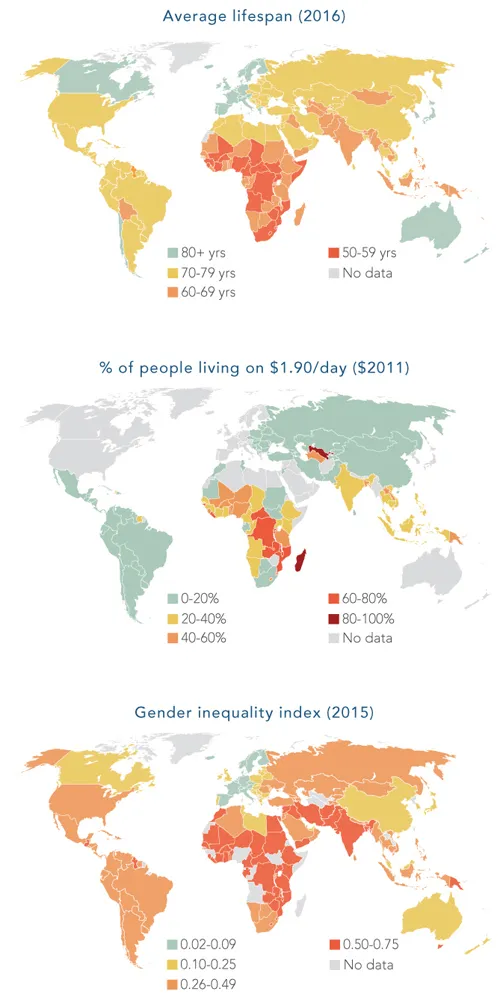
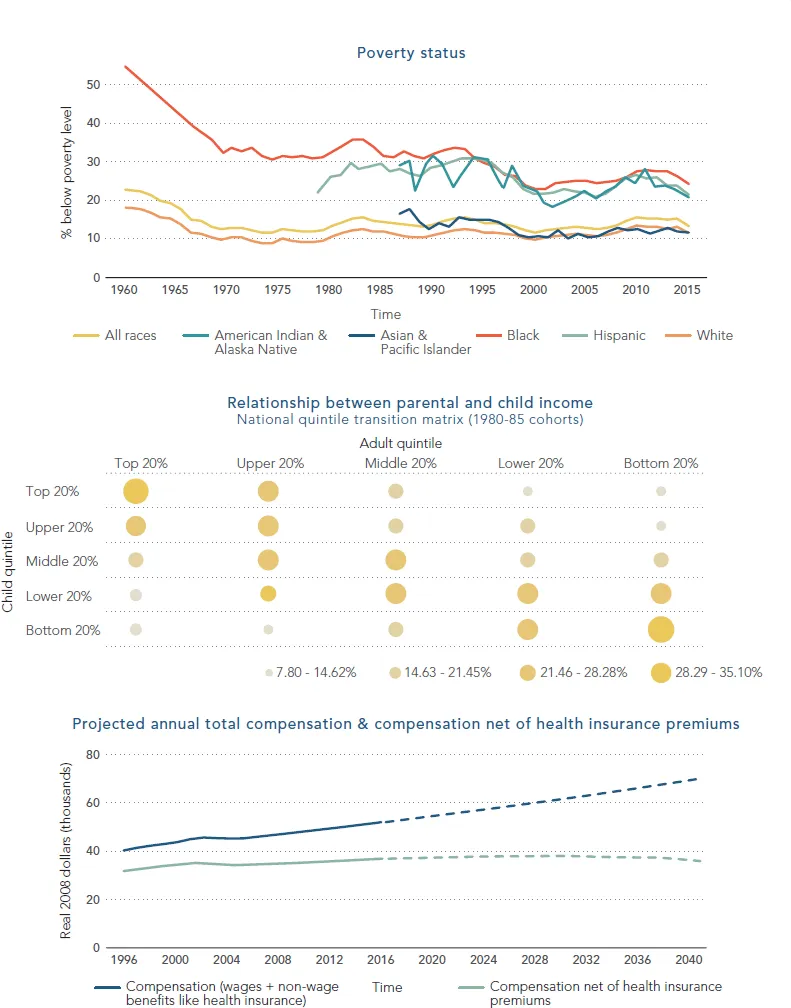
Poverty and inequality limit men and women worldwide from achieving life's potential.
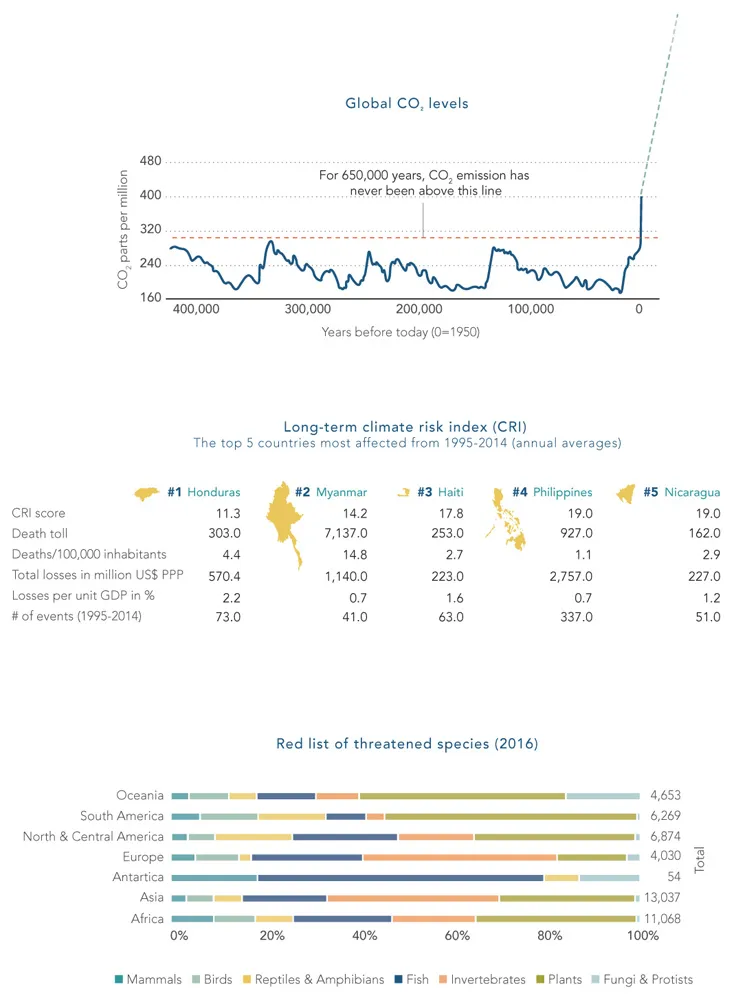
Human-induced climate change threatens vulnerable populations and drives extinctions.
Pessimism And Inequality Are
Destabilizing National Threats
Less trust, more fear, and social isolation threaten the bonds of democracy.
The American Dream is threatened by persistent inequality and spiraling health costs.
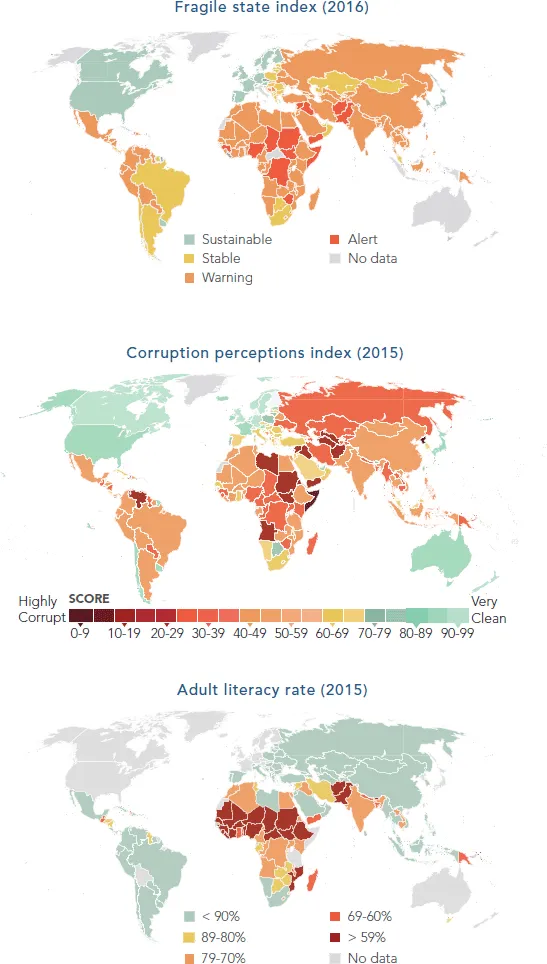
Ineffective Governments And Closed Or
Rigged Markets Are Top Global Barriers
Fragile governments, corruption, and underdevelopment retard global growth.
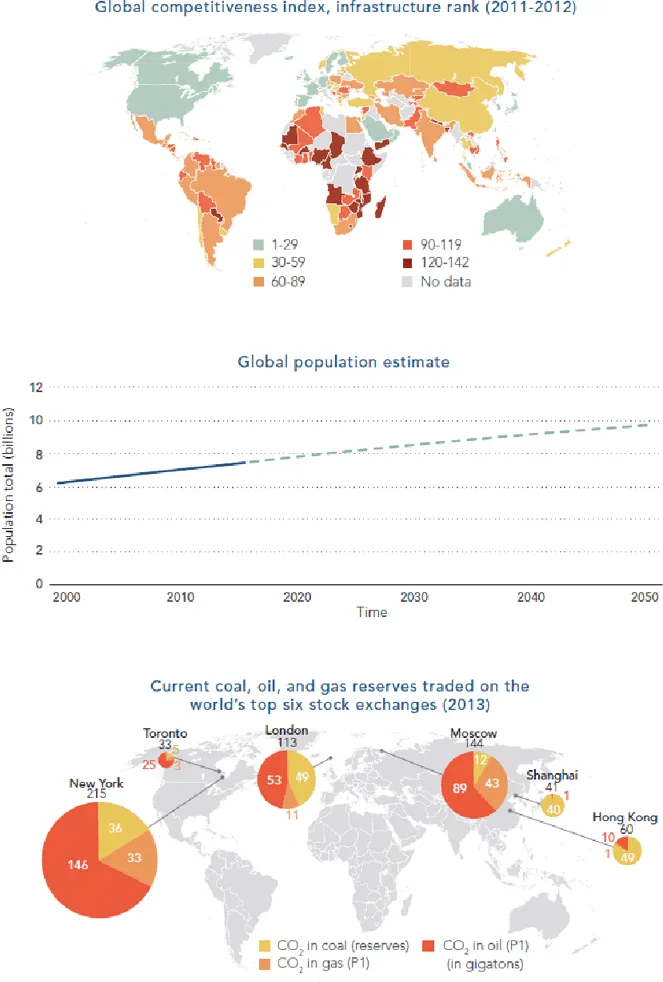
The private sector is key to meeting the needs of new billions while stranding carbon.
A Broken Congress And A Materialist
Culture Are Barriers To U.S. Progress
Special interests and gridlock lead to underinvestment and a tilted playing field.
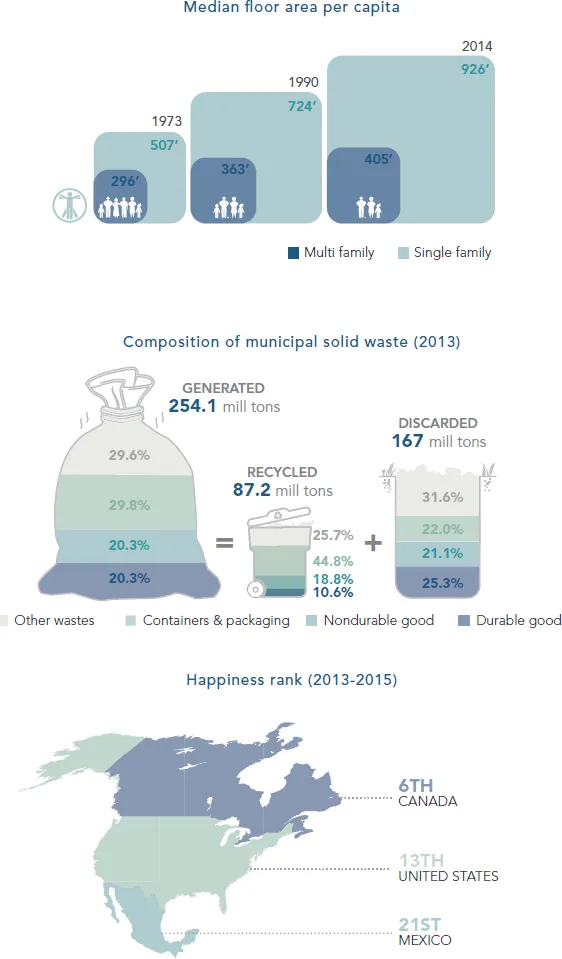
Our material consumption makes us less happy than those with less stuff.
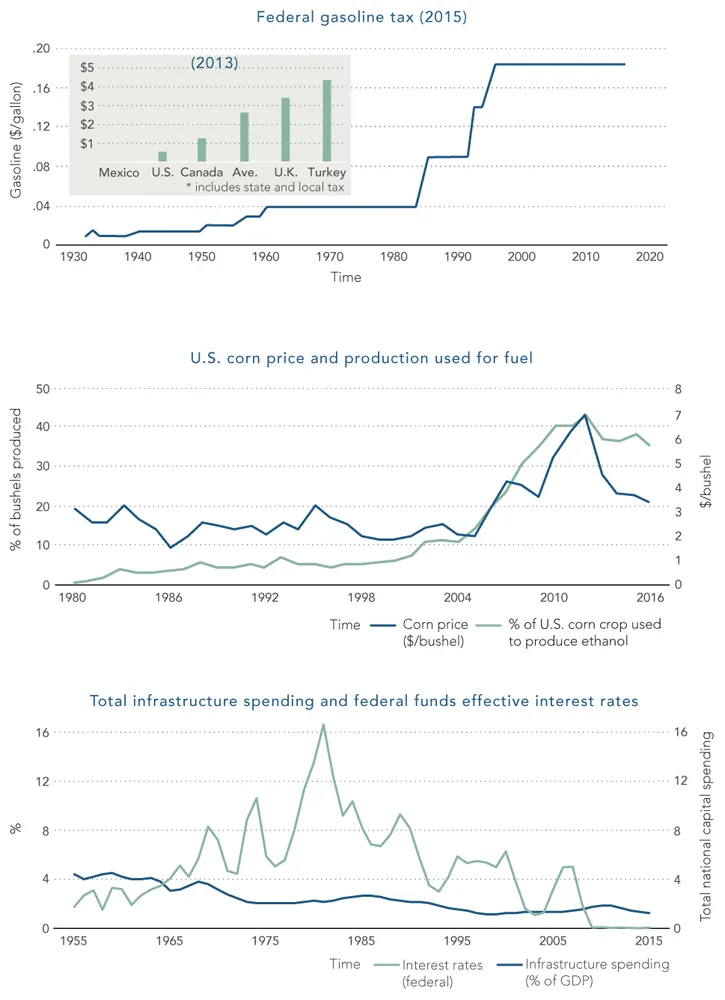
Public Policies Prompt Private Sector
Innovation To Advance Global Progress
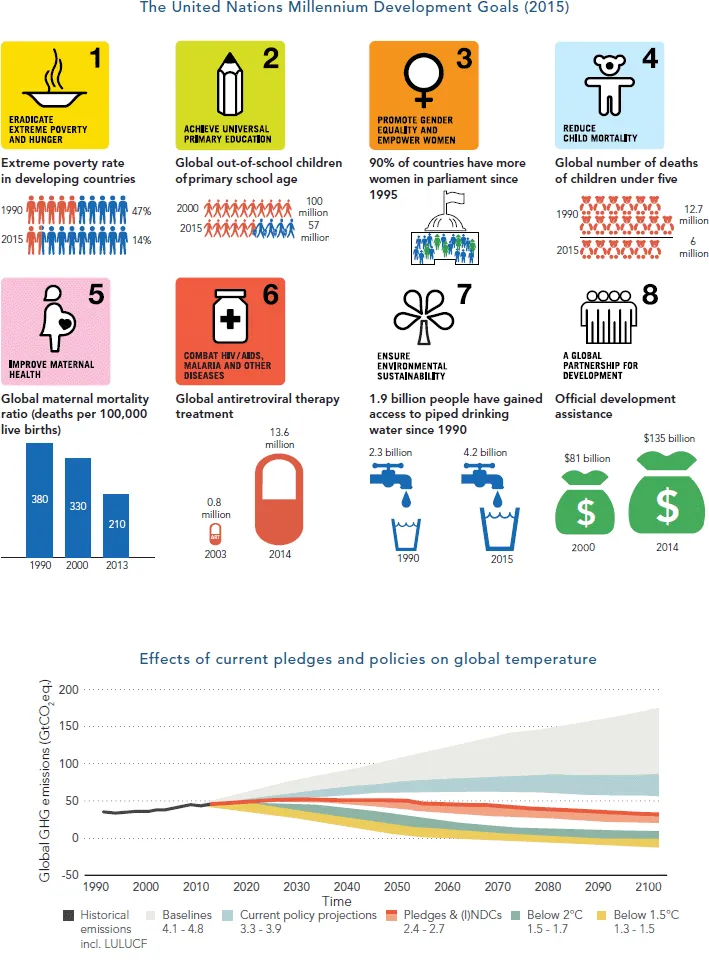
The success of The Millennium Development Goals previews the Paris Agreement.
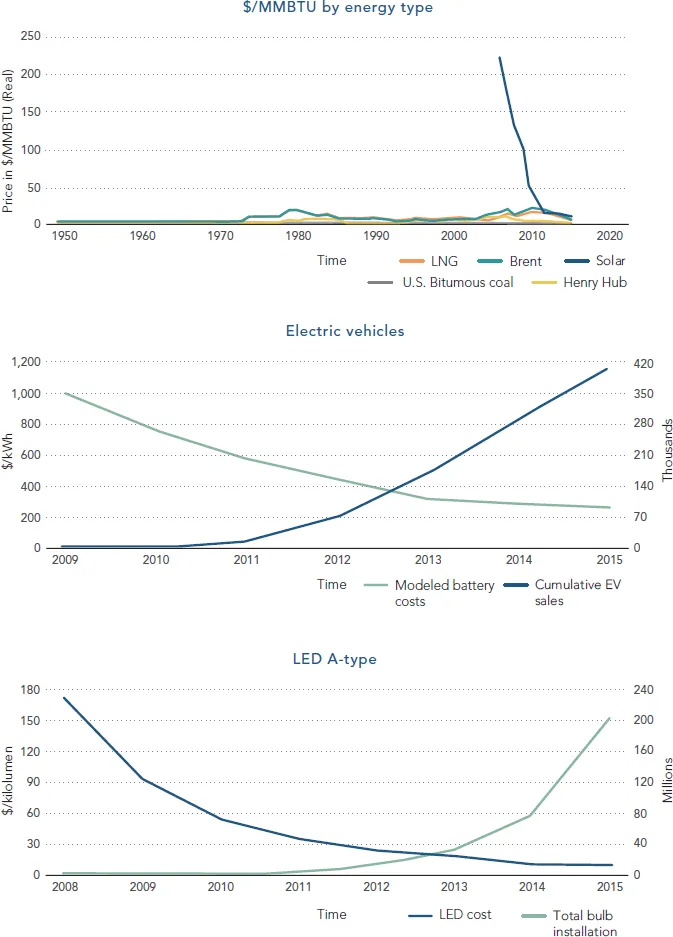
Fast global growth is driving renewable costs to below those of conventional technologies.
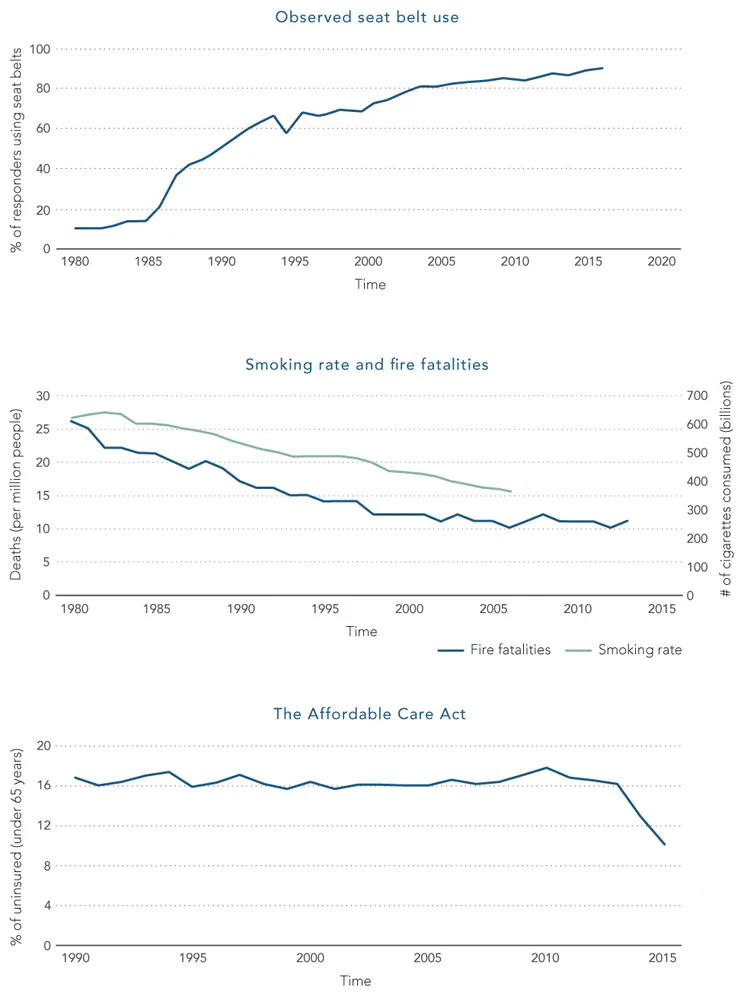
While Work Remains, The U.S. Is Healthier,
Safer, And Better Off Than Ever Before
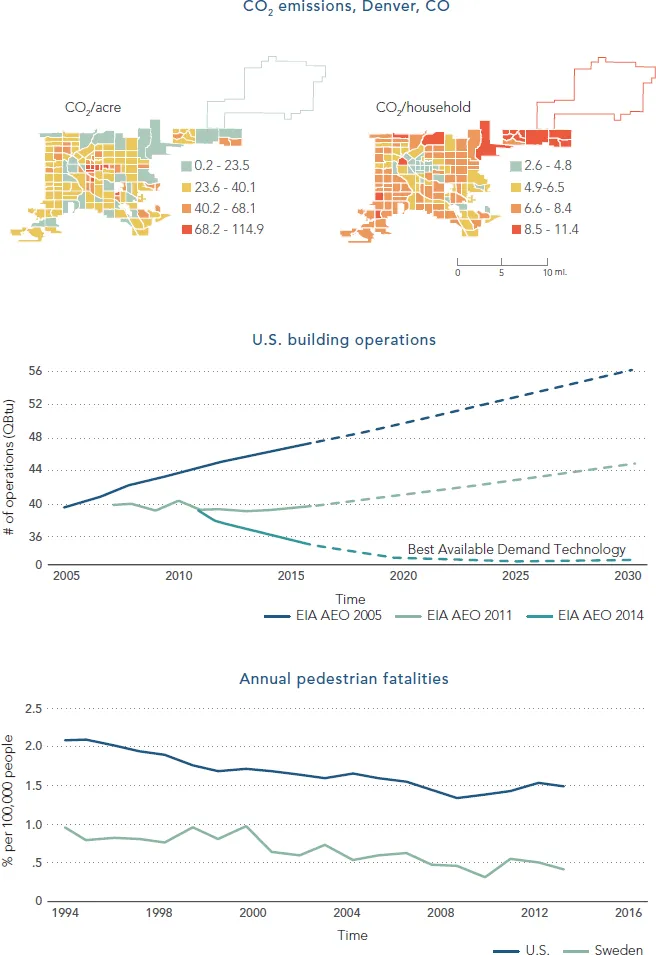
State and federal policies have saved and improved the lives of countless Americans.
The design of the built environment shapes our health, safety, and well-being.
Endnotes
References
- Chapter cover image: Free-Photos via Pixabay.com/ Creative Commons CC0
Civilization Timeline
- The World Bank. (2016). World Development Indicators. Life expectancy at birth, total (years). http://data.worldbank.org/indicator/SP.DYN.LE00.IN; accessed August 31, 2016.
- Ancient History Encyclopedia. (n.d.). www.ancient.eu/.
- A&E Networks. (n.d.). History.com.
- Wikipedia. (n.d.). www.wikipedia.org/.
Global Threats
Average Lifespan
- The World Bank. (2016). World Development Indicators. Life expectancy at birth, total (years). http://data.worldbank.org/indicator/SP.DYN.LE00.IN; accessed August 31, 2016.
Poverty Data
- The World Bank. (2016). World Development Indicators. Poverty headcount ratio at $1.90 a day (2011 PPP) (% of population). http://data.worldbank.org/indicator/SI.POV.DDAY; accessed August 31, 2016.
Gender Inequality Index
- United Nations Development Programme (UNDP). (2015). UNDP Human Development Reports 2015. Table 5: Gender Inequality Index. http://hdr.undp.org/en...
Table of contents
- Cover
- Title Page
- Copyright
- Dedication
- Foreword
- Preface
- Acknowledgments
- Part One: Our Default World
- Part Two: Our Preferred Future
- Part Three: Theory of Change
- Part Four: The Practice of Change
- Epilogue
- Glossary
- Index
- End User License Agreement
Frequently asked questions
Yes, you can cancel anytime from the Subscription tab in your account settings on the Perlego website. Your subscription will stay active until the end of your current billing period. Learn how to cancel your subscription
No, books cannot be downloaded as external files, such as PDFs, for use outside of Perlego. However, you can download books within the Perlego app for offline reading on mobile or tablet. Learn how to download books offline
Perlego offers two plans: Essential and Complete
- Essential is ideal for learners and professionals who enjoy exploring a wide range of subjects. Access the Essential Library with 800,000+ trusted titles and best-sellers across business, personal growth, and the humanities. Includes unlimited reading time and Standard Read Aloud voice.
- Complete: Perfect for advanced learners and researchers needing full, unrestricted access. Unlock 1.5M+ books across hundreds of subjects, including academic and specialized titles. The Complete Plan also includes advanced features like Premium Read Aloud and Research Assistant.
We are an online textbook subscription service, where you can get access to an entire online library for less than the price of a single book per month. With over 1.5 million books across 990+ topics, we’ve got you covered! Learn about our mission
Look out for the read-aloud symbol on your next book to see if you can listen to it. The read-aloud tool reads text aloud for you, highlighting the text as it is being read. You can pause it, speed it up and slow it down. Learn more about Read Aloud
Yes! You can use the Perlego app on both iOS and Android devices to read anytime, anywhere — even offline. Perfect for commutes or when you’re on the go.
Please note we cannot support devices running on iOS 13 and Android 7 or earlier. Learn more about using the app
Please note we cannot support devices running on iOS 13 and Android 7 or earlier. Learn more about using the app
Yes, you can access Sustainable Nation by Douglas Farr in PDF and/or ePUB format, as well as other popular books in Architecture & Urban Planning & Landscaping. We have over 1.5 million books available in our catalogue for you to explore.