![]()
PART ONE
FINANCIAL REPORT FUNDAMENTALS
![]()
CHAPTER 1
FINANCIAL STATEMENT BASICS
THE REAL MEAT AND POTATOES OF FINANCIAL REPORTS
To start this book it is important to understand that every for-profit business, nonprofit organization, governmental entity, and/or just about any type of “entity” you can think of need financial reports or financial statements (which represent the meat and potatoes of the financial reports). Without financial statements, managing the interests of these entities would be damn near impossible. Creditors such as banks, suppliers, landlords, and the like would not be able to assess the economic performance of the entity (and decide if credit should be extended). Management would not be able to determine how the entity is performing, including the rather novel concept of whether the entity is actually making or losing money (something the federal government doesn’t appear to have to worry about but we’ll leave this topic for another time). Investors would not be able to determine if their investments in the entity are actually worth anything. And completing and filing periodic tax returns to the slew of taxing authorities all entities must inevitably comply with would be challenging, to say the least.
Countless other examples of why financial statements are needed could be cited, so rather than burn an entire chapter on listing every potential scenario, let’s stay focused on two important acronyms as they apply to financial statements.
As we proceed through this book and assist the reader with understanding the basics of financial statements, a constant theme is also presented in helping readers understand and identify when CART financial statements are being produced compared to applying the SWAG method. We note that you generally won’t find these acronyms listed in any official accounting literature, formal accounting guidance reference material, and so on, as these terms are centered more on how accounting is applied and conducted on “the street” as opposed to how accounting theory and principles are taught “in the classroom.” But whether CART or SWAG is applied, the same concept still holds as it relates to preparing financial statements and the consequences of not completing even the basics, as Twitter found out the hard way!
Critical Terminology Alert—CART versus SWAG
CART stands for Complete, Accurate, Reliable, and Timely. This is how financial statements should be produced—in a complete, accurate, reliable, and timely manner. SWAG stands for Scientific Wild Ass Guess. And yes, let’s just say that more than a few companies have produced financial statements utilizing the ever-so-popular SWAG methodology.
The Big Three—Financial Condition, Profit Performance, and Cash Flows
As previously noted, business managers, lenders, investors, governmental organizations, and the like (collectively referred to as the parties throughout this book) need to have a clear understanding of the financial condition of a business, both at a point in time and over a period of time. The primary objective of the big three financial statements summarized in this segment of the chapter is to achieve just this goal.
First Up, the Balance Sheet
Parties need to assess the financial condition of a business at a point in time. For this purpose they need a report that summarizes its assets (what the business owns) and liabilities or obligations (what the business owes), as well as the ownership interests in the residual of assets in excess of liabilities (which is commonly referred to as owners’ equity). Understanding the financial condition of a business is best measured by number one on the list of the big three financial statements—the balance sheet.
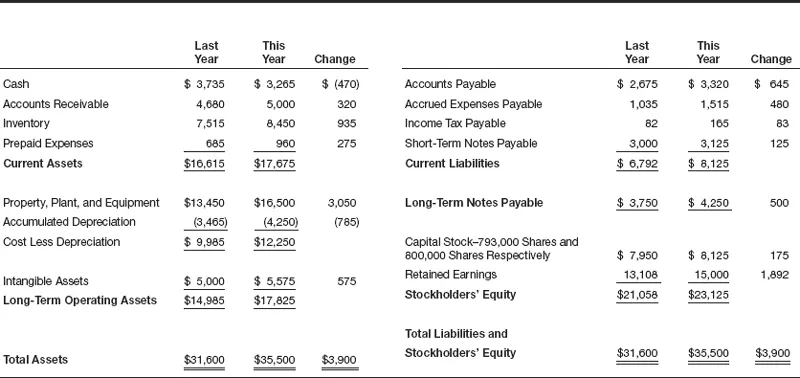
Exhibit 1.1 presents a standard balance sheet for a business entity.
EXHIBIT 1.1—YEAR-END BALANCE SHEETS
Dollar Amounts in Thousands
When first reviewing the balance sheet a number of items should jump out at the reader including the format used, the different groupings of assets, liabilities, and equity, the allocation of assets and liabilities between current and long-term, and other details. All of these concepts are discussed in Chapter 3, “Mastering the Balance Sheet,” but if there is one extremely important concept that must be understood with the balance sheet it is this—the balance sheet must balance. That is, total assets must equal total liabilities plus shareholders’ equity. If not, well I can only think of the line quoted by Tom Hanks who played astronaut Jim Lovell in the movie Apollo 13—“Houston, we have a problem.”
Next in Line, the Income Statement
Second up on our list of the big three financial statements is based on the simple concept of knowing (by the parties) whether a business has generated a profit or incurred a loss over a period of time. For this purpose, the business needs a report that summarizes sales or revenues against expenses or costs for a given period and the resulting profit generated or loss incurred. This financial statement is most commonly known as the income statement or similarly, the profit and loss statement (or P&L for short).
Exhibit 1.2 presents a typical income statement for the same business entity the balance sheet was presented in Exhibit 1.1.
EXHIBIT 1.2—INCOME STATEMENT FOR YEAR
Dollar Amounts in Thousands
| Sales Revenue | $52,000 |
| Cost of Goods Sold Expense | (33,800) |
| Gross Profit | $18,200 |
| Selling, General, and Administrative Expenses | (12,480) |
| Depreciation Expense | (785) |
| Earnings before Interest and Income Tax | $ 4,935 |
| Interest Expense | (545) |
| Earnings before Income Tax | $ 4,390 |
| Income Tax Expense | (1,748) |
| Net Income | $ 2,642 |
Chapter 4, titled Understanding Profit, on understanding the income statement has been dedicated to breaking down the income statement in more detail but similar to the balance sheet, one important concept must be understood—profit ≠ success and losses ≠ failure. That is, generating a profit does not mean that the business is financially sound and is guaranteed success and conversely, incurring a loss does not mean the business is going to fail. Financial statements need to be understood in their entirety before a judgment can be passed on the long-term financial viability of the business.
Bringing Up the Rear, the Statement of Cash Flows
And, finally the parties need a summary of its cash flows for a period of time. Similar to the income statement, cash flows are measured over a period of time (generally the same length of time as the income statement such as a month, quarter, or year) but unlike the income statement (which measures total sales or revenues against total expenses or costs to calculate the profit or loss), cash flows are best understood by distinguishing between where cash comes from (the sources) and where cash goes (the uses). This brings us to the last of the big three financial statements, which is the statement of cash flows.
Exhibit 1.3 presents a typical statement of cash flows for the same business entity the balance sheet was presented in Exhibit 1.1 and income statement was presented in Exhibit 1.2.
EXHIBIT 1.3—STATEMENT OF CASH FLOWS FOR YEAR
Dollar Amounts in Thousands
| Cash Flow from Operating Activities | | |
| Net Income (from Income Statement) | $ 2,642 | |
| Accounts Receivable Increase | (320) | |
| Inventory Increase | (935) | |
| Prepaid Expenses Increase | (275) | |
| Depreciation Expense | 785 | |
| Accounts Payable Increase | 645 | |
| Accrued Expenses Payable Increase | 480 | |
| Income Tax Payable Increase | 83 | $3,105 |
| Cash Flow from Investing Activities | | |
| Expenditures for Property, Plant, and Equipment | $(3,050) | |
| Expenditures for Intangible Assets | (575) | (3,625) |
| Cash Flow from Financing Activities | | |
| Increase in Short-Term Debt | $ 125 | |
| Increase in Long-Term Debt | 500 | |
| Issuance of Additional Capital Stock Shares | 175 | |
| Distribution of Cash Dividends from Profit | (750) | 50 |
| Decrease in Cash During Year | | $ (470) |
| Cash Balance at Start of Year | | 3,735 |
| Cash Balance at End of Year | | $3,265 |
In our business travels, there is no question that the statement of cash flows is without doubt the least understood of the big three financial statements but at the same time, the most important. Understanding how a business generates and consumes cash is discussed in more depth in Chapter 2 and as you start that chapter it is important to keep the most critical of concepts at the forefront of your thoughts as it relates to cash flows–profit ≠ positive cash flow and a loss ≠ negative cash flow.
For a perfect example of just how significant the difference can be between profit and cash flow, please refer to page 50 of Netflix’s 2012 annual report (available online) and you see that for the fiscal year-end 2012, Netflix generated a profit of $17,152,000 or the company was “i...