![]()
Chapter 1
NMR Spectroscopy Basics
1.1 THE PHYSICS OF NUCLEAR SPINS
Any nucleus that has an odd number of protons and/or neutrons has a property called “nuclear spin”. Such nuclei are termed “NMR-active nuclei” and, in principle, these nuclei can be observed by Nuclear Magnetic Resonance (NMR) spectroscopy.
Any nucleus that has an even number of protons and an even number of neutrons has no nuclear spin and cannot be observed by NMR. Nuclei with no nuclear spin are “NMR-silent nuclei”. Common nuclei that fall into the NMR-silent category include carbon-12 and oxygen-16. Fortunately, with a few exceptions, most elements do have at least one isotope that has a nuclear spin, and so while 12C and 16O are NMR-silent, we can observe NMR spectra for the less abundant isotopes of carbon and oxygen, 13C and 17O. So even the elements where the most abundant isotope is NMR-silent can usually be observed via one or more of the less abundant isotopes.
Each nucleus has a unique nuclear spin, which is described by the spin quantum number, I. Nuclear spin is quantised, and I has values of 0, 1/2, 1, 3/2 etc. NMR-silent nuclei have I = 0. Each nuclear spin also has a magnetic moment, μ. The nuclear spin and the magnetic moment are related by Equation 1-1:
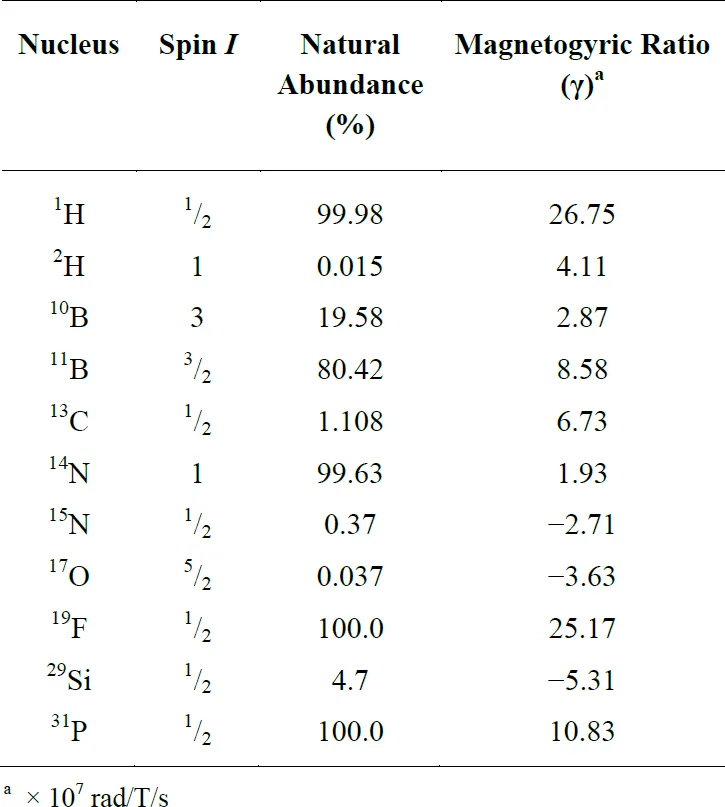
The constant of proportionality, γ, is known as the magnetogyric ratio, and γ is unique for each NMR-active isotope. Table 1-1 provides a summary of the nuclear spins of some of the common NMR-active nuclei.
Table 1-1 Nuclear spins and magnetogyric ratios for some common NMR-active nuclei.
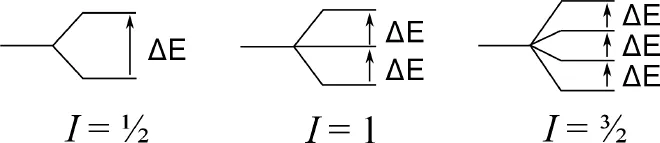
The combination of spin and charge means that NMR-active nuclei behave like small magnets and when a nucleus with a nuclear spin I is placed in an external magnetic field, that nucleus may assume one of 2I + 1 orientations relative to the direction of the applied field.
So, for a nucleus with I = 1/2 like 1H or 13C, there are two possible orientations, which can be pictured as having the nuclear magnet aligned either parallel or antiparallel to the applied field. For nuclei with I = 1 there are three possible orientations; for nuclei with I = 3/2 there are four possible orientations and so on.
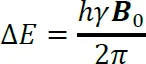
The various orientations of a nuclear magnet in a magnetic field are of unequal energy, and the energy gap (ΔE) is proportional to the strength of the applied magnetic field (B0) according to Equation (1-2:
where h is the Planck constant.
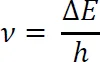
Nuclei in a lower energy orientation can be excited to the higher energy orientation by a radiofrequency (Rf) pulse of the correct frequency (v) according to Equation (1-3:
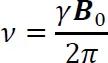
It follows from Equations (1-2 and (1-3 that the fundamental equation that relates frequency (v) to magnetic field strength (B0) is Equation (1-4 which is known as the Larmor Equation:
The Larmor equation specifies that the frequency required to excite an NMR-active nucleus is proportional to the strength of the magnetic field and to the magnetogyric ratio of the nucleus being observed. For magnetic fields that are currently accessible routinely for NMR spectroscopy (up to about 21 T), the frequencies required to observe most common NMR-active nuclei fall in the Rf range of the electromagnetic spectrum (up to about 900 MHz).
Table 1-2 summarises the NMR frequencies of common NMR-active nuclei.
Table 1-2 Resonance frequencies for some common NMR-active nuclei in different magnetic fields.
1.2 BASIC NMR INSTRUMENTATION AND THE NMR EXPERIMENT
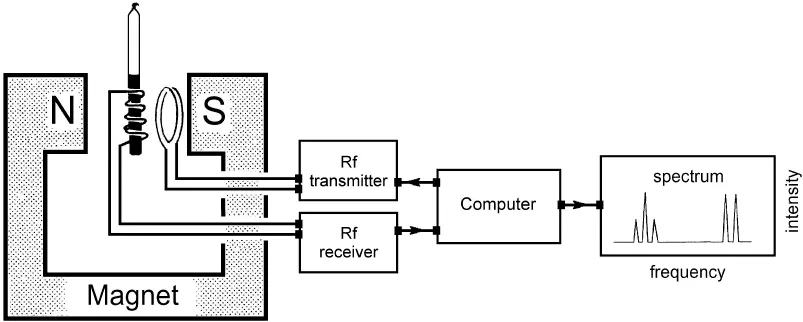
Samples for NMR spectroscopy are typically liquids (solutions) or solids. In order to observe Nuclear Magnetic Resonance, the sample must be placed in a strong magnetic field.
Magnets for NMR spectroscopy may be either permanent magnets or electromagnets. Most modern magnets are electromagnets based on superconducting solenoids, cooled to liquid helium temperature.
NMR spectrometers require an Rf transmitter which can be tuned to the appropriate frequency for the nucleus one wishes to detect (Equation (1-4) and an Rf detector or receiver to observe the Rf radiation absorbed and emitted by the sample. In most modern instruments, the Rf transmitter and the Rf receiver are controlled by a computer and the detected signal is captured in a computer which then allows processing and presentation of the data for analysis.
![]()
Chapter 2
One-Dimensional Pulsed Fourier Transform NMR Spectroscopy
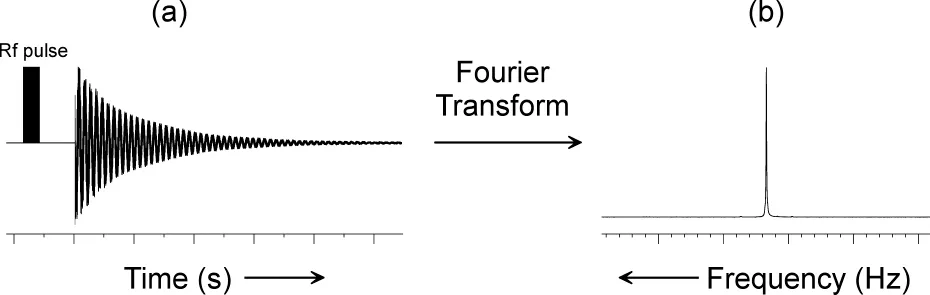
A short pulse of radiofrequency radiation will simultaneously excite all of the nuclei whose resonance frequencies are close to the frequency of the pulse. If a sample placed in a magnetic field of 9.395 T contains 31P nuclei, then a pulse whose frequency is close to 161.9 MHz will excite all of the 31P nuclei in the sample. Typically, the excitation pulse is very short in duration (microseconds). Once the pulse is switched off, the magnetisation which builds up in the sample begins to decay exponentially with time. A pulsed NMR spectrometer measures the decrease in sample magnetisation as a function of time, and records the free-induction decay (FID) (Figure 2-1).
The FID is a time domain signal (i.e. a signal whose amplitude is a function of time), and contains information for each resonance in the sample, superimposed on the information for all the other resonances. The FID signal may be transformed into the more easily interpreted frequency domain spectrum (i.e. a signal whose amplitude is a function of frequency), by a mathematical procedure known as Fourier transformation (FT). The frequency domain spectrum is the typical NM...