Achieve best-in-class metrics and get more from your data with JMP
JMP Connections is the small- and medium-sized business owner's guide to exceeding customer expectations by getting more out of your data using JMP. Uniquely bifunctional, this book is divided into two parts: the first half of the book shows you what JMP can do for you. You'll discover how to wring every last drop of insight out of your data, and let JMP parse reams of raw numbers into actionable insight that leads to better strategic decisions. You'll also discover why it works so well; clear explanations break down the Connectivity platform and metrics in business terms to demystify data analysis and JMP while giving you a macro view of the benefits that come from optimal implementation. The second half of the book is for your technical team, demonstrating how to implement specific solutions relating to data set development and data virtualization. In the end, your organization reduces Full Time Equivalents while increasing productivity and competitiveness.
JMP is a powerful tool for business, but many organizations aren't even scratching the surface of what their data can do for them. This book provides the information and technical guidance your business needs to achieve more.
Learn what a JMP Connectivity Platform can do for your business
Understand Metrics-on-Demand, Real-Time Metrics, and their implementation
Delve into technical implementation with information on configuration and management, version control, data visualization, and more
Make better business decisions by getting more and better information from your data
Business leadership relies on good information to make good business decisions—but what if you could increase the quality of the information you receive, while getting more of what you want to know and less of what you don't need to know? How would that affect strategy, operations, customer experience, and other critical areas? JMP can help with that, and JMP Connections provides real, actionable guidance on getting more out of JMP.
Trusted by 375,005 students
Access to over 1.5 million titles for a fair monthly price.
1 Generalized Context for Decision Process Improvement
DECISION PROCESS IMPROVEMENT FOR CORPORATE PERFORMANCE MANAGEMENT
Business is making clear that to stay competitive in the market we need to make decisions quickly and often with disparate data sets. JMP® CONNECTIONS should be viewed as a business-oriented data discovery tool and is not an information technology (IT) or enterprise SAP®1 Centric model because as is so often the case, data sets are not under the control of the IT department. Data may reside in silos, dozens of spreadsheets, or proprietary database applications. Thus, we can best describe this exercise as the “decision process improvement.” If we can improve on the way metrics are produced, it can directly improve the timely implementation of actual decisions for corporate performance management.
The Holy Grail of the Information Age particularly in the information technology (IT) shop is the notion of data integration and interoperability. The Institute of Electrical and Electronics Engineers defines interoperability as:
The ability of two or more systems or components to exchange information and to use the information that has been exchanged.
Unfortunately, interoperability has never been entirely achieved across a large enterprise before.
However, in support of staying competitive, the popular business press and IT periodicals have been pushing “business intelligence” (BI). Business intelligence is a broad category of applications and technologies for gathering, storing, analyzing, and providing access to data to help enterprise users make better business decisions.
As postulated in the Preface, a tough economy implies a propensity to cut back on expenditures across a wide cross section of the enterprise that may also include BI software acquisitions. Utilizing JMP® Pro®, the following pages will show precisely how the development of state-of-the-art metrics can be facilitated without the need for a major capital expenditure (CAPEX) project.
1.1 SITUATIONAL ASSESSMENT (CURRENT STATE)
ADVANCEMENT IN METRICS FOR BUSINESS AUGMENTATION
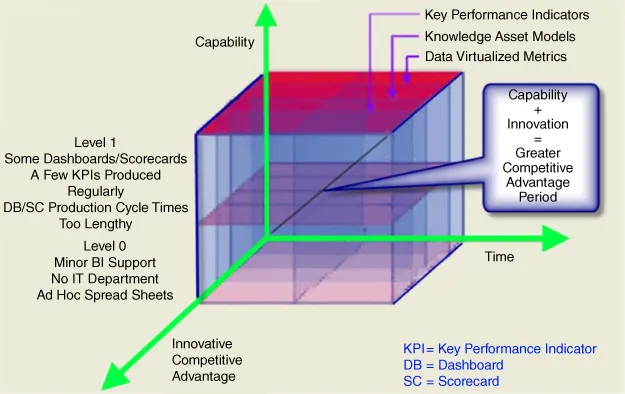
Before describing the common state of affairs that may be typical from small to large businesses, a framework for visualizing capability maturity with regard to the development of metrics and their use is outlined in Figure 1.1.
Figure 1.1 JMP® CONNECTIONS Capability Maturity Model Levels 0 and 1
The lowest level of capability maturity (Level 0) would be a business or organization that may not have an IT department. Most of the management and reporting of business data is done using spreadsheets and perhaps the facilities of software office suites/applications for presentations. Reporting may be ad hoc or sporadic due to such factors as data that is not readily in a form for use in conducting statistical analysis when required. Companies often have so much data that they realize knowledge is locked up; however, they have no practical, inexpensive way to develop and utilize it.
The first level of maturity (Level 1) is where companies produce dashboards, scorecards, and KPIs on a regular basis. Perhaps on an annual basis, metrics are reviewed for relevance as needs change over time. Metrics retained may be refined and presentation and timely delivery mechanisms are level set2 depending on who is to be receiving them and at what levels of the enterprise they are to be receiving and using them. Publishing BI tools like dashboards (DBs) and scorecards (SCs) have measurable cycle times.
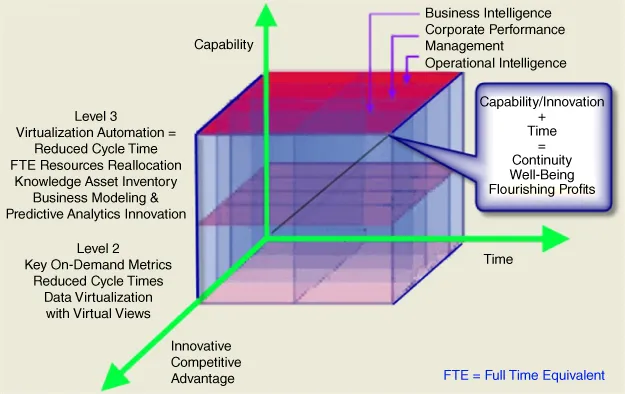
The second level of maturity (Level 2) for an organization would be a realization that some subset of deliverable metrics could be converted to metrics “on-demand.” In identifying these on-demand metrics, the cycle time to generate or refresh a set of deliverable dashboards would be completely eliminated. (See Figure 1.2.)
Figure 1.2 JMP® CONNECTIONS Capability Maturity Model Levels 2 and 3
The third and highest level of maturity (Level 3) is a two-part configuration. (See Figure 1.2.)
Level 3, Part 1
Eliminate cycle time to create on-demand metrics resulting in reduction in FTEs.
Level 3, Part 2
Human capital resource reallocation for:
Performing advanced statistical analysis
Predictive analytics and modeling
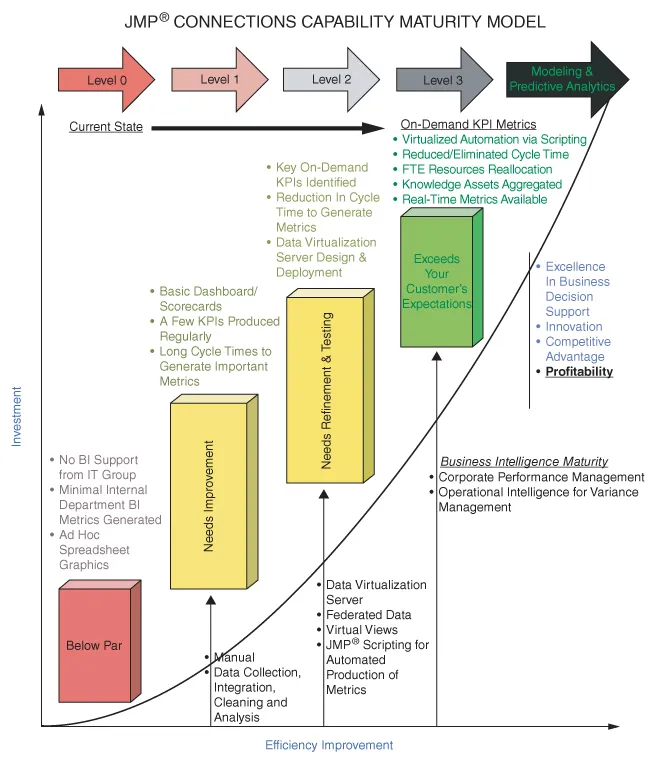
Level 3, Part 1, maturity level, focuses on reducing the time it takes (cycle time) to produce the metrics on a scheduled basis, thus in turn reducing the number of FTEs required to produce those metrics. One FTE required to update a dashboard every week does not leave enough time for any other production tasks for metrics. The amount of time for an FTE is finite. As hours are freed up, other knowledge within the data sets can be developed and utilized. Achieving the second level of maturity leads into Level 3, Part 2 because now predictive analytics and the full power of JMP® Pro can be leveraged perhaps without the addition of more FTEs. The graphic view in Figure 1.3 summarizes the reference model for maturity capability for business intelligence metrics.
Figure 1.3 JMP® CONNECTIONS Capability Maturity Reference Model
The development of JMP® CONNECTIONS is applicable to literally every type of business. All examples cited in this book are totally fictional and for illustrative purposes, which can be adapted to any business. The examples are generic in the sense that the common fuel crucial to business execution is the enterprise data, mature knowledge assets, and performance indicators across the spectrum of organizations that desire optimal results. In many circumstances, particularly in larger firms, one expects to find whatever data they need on the large enterprise database applications. In fact, the information is out there but its access is less than ideal. It may in no way be in a format to provide any statistical analysis capability. It lacks a certain agility for manipulative processes for generating BI tools or data. It is a “what you see is what you get” due to the hard-coded requirements built into the application. Consequently, a query returned is often a table of data or records that do not necessarily communicate or impart knowledge to the recipient. Something extra needs to be done.
Additionally, one would think that, especially within technology firms or scientific and engineering firms, data management would be state of the art. For many and perhaps for a majority, business is conducted using spreadsheets, small desktop database applications, web applications, text files, and sticky notes. In fact, the proliferation of spreadsheets from one year to the next with no sense of version control is prevalent where many sheets act as placeholders for data rather than actually doing any computations or analysis.
Given the standard corporate desktop environment, when a set of metrics are required, they are likely prepared using a combination of the office suite applications. These may include the word processor, spreadsheet, and presentation software applications. A chart or graph may be present with some annotation explaining the meaning of the numbers and is the bare minimum or Level 0 of maturity for making metrics. Thus, it is useful to point out here exactly what types of BI solutions exist.
Executive scorecards and dashboards
Online Analytical Processing (OLAP) analysis
Ad hoc reporting
Operational reporting
Forecasting
Data mining
Customer intelligence
Each of the BI solutions has a data analysis ingredient or function that derives the reported out metric for a particular BI solution. While features and functions may be alike, what sets these apart is how they are applied to support decision making.
To be more precise in thinking about analytic metrics, there are three areas of data analysis derived from data science, information technology, and business applications that can be categorized as follows:
* PREDICTIVE (Forecasting)
* DESCRIPTIVE (Business Intelligence and Data Mining)
* PRESCRIPTIVE (Modeling, Optimization, and Simulation)
Without efficient sharing of operational business intelligence, a company is...
Table of contents
Cover
Title Page
Table of Contents
List of Figures
Preface
1 Generalized Context for Decision Process Improvement
2 Real-Time Metrics Business Case
3 Technical Details and Practical Implementation
4 Harvesting Benefits and Extensibility
5 So What About a Bad Economy?
6 Decision Streams
7 Delivery and Presentations
8 In Closing (As-Built)
Glossary
APPENDIX A: Server-Side PHP Code
APPENDIX B: JMP® JSL Time Constant Learning Curve Script
APPENDIX C: JMP® GUI User Interface Code Example
APPENDIX D: Resource Description Framework File Example
APPENDIX E: Sample Hardware Requirements
APPENDIX F: Early Warning Deliverable
APPENDIX G: JMP® PRO Connections: The Transversality of the Capability Maturity Model
References
Suggested Reading
Index
End User License Agreement
Frequently asked questions
Yes, you can cancel anytime from the Subscription tab in your account settings on the Perlego website. Your subscription will stay active until the end of your current billing period. Learn how to cancel your subscription
No, books cannot be downloaded as external files, such as PDFs, for use outside of Perlego. However, you can download books within the Perlego app for offline reading on mobile or tablet. Learn how to download books offline
We are an online textbook subscription service, where you can get access to an entire online library for less than the price of a single book per month. With over 1.5 million books across 990+ topics, we’ve got you covered! Learn about our mission
Look out for the read-aloud symbol on your next book to see if you can listen to it. The read-aloud tool reads text aloud for you, highlighting the text as it is being read. You can pause it, speed it up and slow it down. Learn more about Read Aloud
Yes! You can use the Perlego app on both iOS and Android devices to read anytime, anywhere — even offline. Perfect for commutes or when you’re on the go. Please note we cannot support devices running on iOS 13 and Android 7 or earlier. Learn more about using the app
Yes, you can access JMP Connections by John Wubbel in PDF and/or ePUB format, as well as other popular books in Computer Science & Data Processing. We have over 1.5 million books available in our catalogue for you to explore.