![]()
CHAPTER 1
Perspectives on Active and Passive Money Management
This chapter introduces key perspectives designed to help you get the most out of the readings, exercises, and activities featured in the chapters that follow. The learning objectives for this chapter are:
1. Display an understanding of the chapter terminology and describe the top-down fundamental analysis process.
2. Explain why stocks with superior fundamentals often have higher returns and lower risk over long horizons.
3. Summarize the results of studies that investigate the performance of professional investors and what motivates investors to trade more actively.
4. Identify the three major theories of the way information gets incorporated into stock prices, and summarize the major premises of each theory.
5. Summarize the perspectives of esteemed investors and authors provided in the chapter.
6. Interpret the insights into financial markets from Chapter 12 of John Maynard Keynes's General Theory of Employment, Interest and Money.
7. Discuss the importance of an investment policy statement.
TERMINOLOGY: INVESTORS, INVESTMENT VEHICLES, RISK AND RETURN
Equity investing can be divided into two main categories: passive and active. Passive investors buy and hold stocks for the long term. They construct portfolios or choose investment vehicles that minimize costs, including research costs, trading costs, administrative costs, performance fees, and taxes on realized gains. The most popular types of passive investment vehicles include “index” mutual funds and exchange-traded funds (ETFs), which are designed to imitate the performance of indexes like the S&P 500. Active investors, however, seek to outperform the indexes by identifying individual stocks to buy and sell. Because they trade more often, active investors turn their portfolios over more frequently than passive investors and usually incur higher costs.
Relative versus Absolute Return Investing
Active investing can be further divided into two main categories. Relative return vehicles seek to outperform a benchmark index (like the Standard & Poor's [S&P] 500), where “outperformance” is measured as a combination of either earning higher returns and/or achieving lower risk exposure. Most equity portfolios, including equity mutual funds and student investment funds, are relative return vehicles, where the fund's performance is evaluated relative to a widely followed benchmark. Absolute return vehicles seek to deliver returns that are less risky but are also usually lower than the returns of most index benchmarks. Many equity hedge funds are absolute return vehicles. Examples include long-short funds that make both positive bets (by owning stocks long) and negative bets (by selling stocks short).
You may notice that the terms active and passive are, to some degree, “loaded” words. In many cultures (especially the United States), being passive is usually considered less desirable than being active. Later in this chapter, you will learn that this is rarely the case in investing, however. The results of numerous research studies show that one of the main reasons passive, buy-and-hold investing is so prevalent is that the majority of active professional investors underperform their benchmarks.
Alpha and Beta: Excess Returns and Market Risk
Alpha refers to the excess returns earned by relative return investors, either above or below the market index to which their performance is benchmarked. When a portfolio outperforms its benchmark index, the percentage return by which the portfolio exceeds the index return will be termed positive alpha. If a portfolio underperforms its benchmark index, we'll say it earned a negative alpha.
Beta is a measure of risk that can apply to an individual stock or to a portfolio of stocks. The average market beta = 1.0. In the case of an individual stock, beta measures how much risk, or volatility, that stock is expected to contribute to the overall volatility of a diversified portfolio. High-beta stocks usually exhibit a more volatile reaction to market-wide or macroeconomic news, on both the upside and downside. Examples of high-beta stocks include cyclical stocks like Caterpillar and Ford. The stock prices of these companies are more volatile because businesses and consumers buy more tractors, cars, and trucks during strong economic times, and cut back on investments in capital assets and purchases of durable goods during weak economic times. Low-beta stocks tend to be less volatile, however, and therefore contribute less volatility to a diversified portfolio. Examples include consumer staples stocks like Nestlé and pharmaceutical stocks like Bristol-Myers. These companies produce items consumers tend to buy regardless of economic conditions.
When applied to a well-diversified equity portfolio, beta is a measure of the market risk, or volatility, of the portfolio. If a portfolio emphasizes high-beta stocks, its returns will tend to be more volatile, and vice-versa if it emphasizes low-beta stocks. Finance theory asserts that risk and expected returns are positively related, which implies that high-beta stock stocks should earn higher returns and low-beta stocks should earn lower returns over long holding periods. Thus, high-beta stock portfolios should outperform low-beta portfolios, as higher returns compensate investors for bearing greater risk. One of the principles of this book is that investors can construct winning portfolios by investing in low-beta stocks, which contradicts the basic wisdom of finance. After introducing a clearer picture of the job of the fundamental analyst in the following section, we will revisit this apparently contradictory assertion. Can investors really have it both ways—lower risk and higher returns?
THE TOP-DOWN FUNDAMENTAL ANALYSIS PROCESS
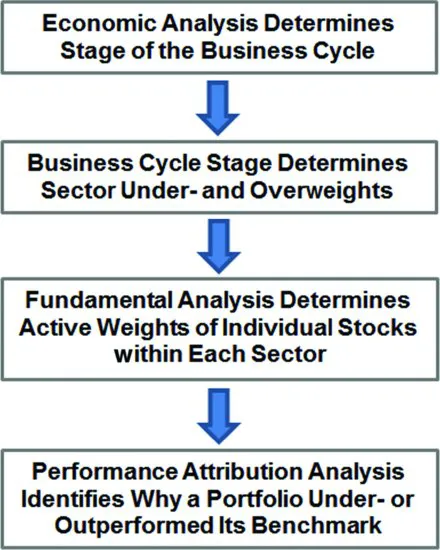
Next we'll take an overview of the fundamental analysis process featured in this book. Our process is termed top-down because it begins with an analysis of the overall economy, with an emphasis on gauging the stage of the business cycle in which the economy is operating (the topic of the following chapter). As we'll see, this activity helps the analyst identify sectors of the stock market in which to deploy new capital, and sectors from which capital should be withdrawn and redeployed.
Analysts divide the stock market into 10 sectors. When an actively managed portfolio allocates funds by sector in a way that differs from their current market weights, we will say the portfolio manager is employing sector overweights and underweights. In Chapter 7 we will attribute the under- or outperformance of a portfolio relative to a benchmark to the sector weights used in the portfolio (in addition to other factors). Once an analyst determines the sectors to over- and underweight relative to the market, he will next determine the stocks with the best prospects to overweight within each sector (and the stocks to sell or sell short, if the fund allows short selling). Figure 1.1 depicts the stages of the top-down fundamental analysis process.
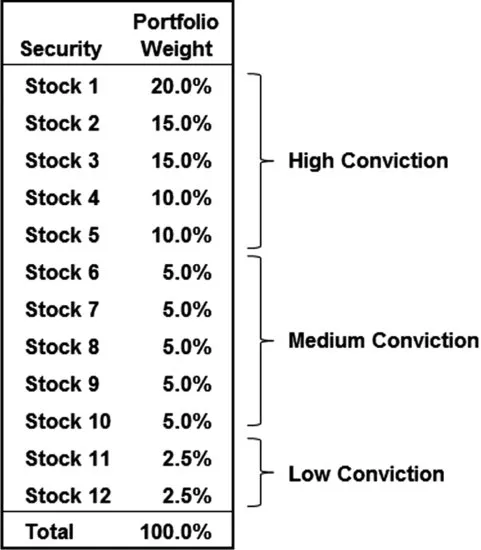
The decision to buy a stock and hold it in a portfolio indicates confidence, or conviction, in the security. But it is unlikely that managers will have the same degree of conviction regarding each stock they own. Figure 1.2 shows the possible “weights” (the percentage of total portfolio wealth invested in each stock) in a 12-stock portfolio, ranked by analyst conviction. Notice how the highest-conviction stocks receive the highest weight and the lowest-conviction stocks receive the lowest weight. Active investors therefore allocate portfolio wealth among stocks differently than these stocks' market-determined weights in the benchmark index. The active investor's weighting scheme will be called active portfolio weights.
Why Stocks with Solid Fundamentals Outperform over Long Horizons
Now that you understand the overall fundamental process, let's take a closer look at exactly how portfolios emphasizing stocks with solid fundamentals outperform over long horizons. First, let's be more specific about what we mean by fundamentals. We're going to learn how to identify stocks whose prices are well supported by the basic building blocks, or fundamentals, that support intrinsic value: revenues, profits, free cash flows, and a commitment to return a large share of that free cash flow to investors, preferably in the form of cash dividends. These characteristics conform to another basic finance principle, which states that an asset's intrinsic value equals today's value of the future free cash flows the asset is expected to generate over its lifetime. This means that we'll learn to identify:
1. Stocks with steadily growing revenues, profits, free cash flows, and dividends.
2. Stocks that achieve this growth by making prudent capital investments.
3. Companies with strong competitive positions that allow them to defend and maintain their market presence, which supports further growth in their fundamentals.
Next, recall the idea of beta—the index of how volatile a stock is likely to be and how much volatility it will contribute to a diversified portfolio. Beginning students of finance often ask an obvious question about volatility that shows more savvy than finance theorists have been able to handle: “Don't we only want to avoid downside volatility?”
There is a lot of wisdom contained in that question, because it indirectly describes how stocks with superior fundamentals win. These types of stocks almost never surge ahead during the market's bull phase. But when markets correct or enter a bear phase—and they always do—stocks with superior fundamentals tend to decline in value much less than their high-beta counterparts. Moreover, after the market correction is over, these stocks usually resume following the market's next upward trend, albeit at a somewhat slower pace. We'll consider three examples to help you better understand these tendencies.
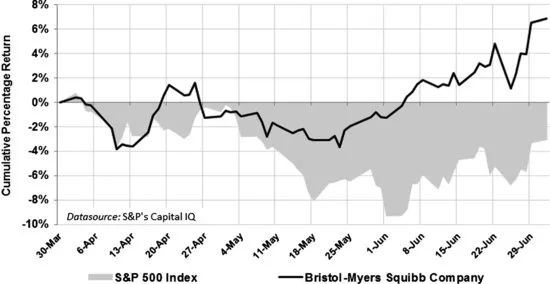
The second quarter of the year is an excellent period to study how the stock market works. Research shows that the stock market tends to earn much of its total annual return early in the calendar year (usually beginning in late December). After the first quarter, however, an old adage holds that investors can “sell in May and go away,” as the market tends to trend sideways or correct after the early-year euphoria fades and investors become more discriminating about the specific stocks they want to own. Let's take a look at the returns of several stocks with solid fundamentals during the second quarter of 2012: Bristol-Myers and Johnson & Johnson.
Figure 1.3 shows how Bristol-Myers (BMY) follows the market through early April, but as investors become increasingly nervous about an impending correction, buyers gradually bid BMY's stock price up until it decouples from the market trend. This occurs because during market corrections, investors sell many of their risky, high-beta stock positions and invest the proceeds in stocks with superior fundamentals. The prices of these stocks are supported by their fundamentals, which makes them most attractive to investors during the market's darkest moods. And because these stocks have a predictable tendency to decline in value by much less than the market, investors' portfolios suffer far less damage (known as drawdowns) during corrections and bear markets. Warren Buffett best summed up this essential principle of investing when he said, “The best way to make a dollar is not to lose a dollar” (Lowe, 1997).
Figure 1.4 depicts a similar pattern for Jo...