
- English
- ePUB (mobile friendly)
- Available on iOS & Android
eBook - ePub
From Big Data to Smart Data
About this book
A pragmatic approach to Big Data by taking the reader on a journey between Big Data (what it is) and the Smart Data (what it is for).
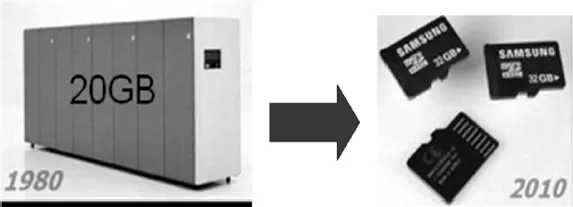
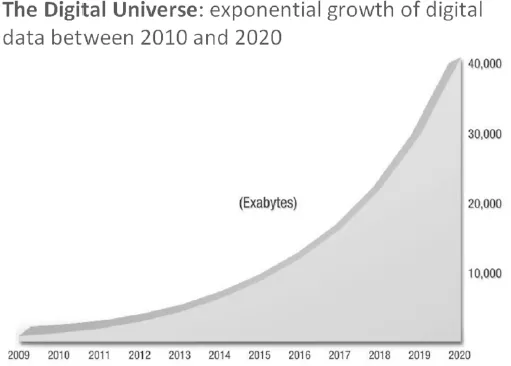
Today's decision making can be reached via information (related to the data), knowledge (related to people and processes), and timing (the capacity to decide, act and react at the right time). The huge increase in volume of data traffic, and its format (unstructured data such as blogs, logs, and video) generated by the "digitalization" of our world modifies radically our relationship to the space (in motion) and time, dimension and by capillarity, the enterprise vision of performance monitoring and optimization.
Frequently asked questions
Yes, you can cancel anytime from the Subscription tab in your account settings on the Perlego website. Your subscription will stay active until the end of your current billing period. Learn how to cancel your subscription.
No, books cannot be downloaded as external files, such as PDFs, for use outside of Perlego. However, you can download books within the Perlego app for offline reading on mobile or tablet. Learn more here.
Perlego offers two plans: Essential and Complete
- Essential is ideal for learners and professionals who enjoy exploring a wide range of subjects. Access the Essential Library with 800,000+ trusted titles and best-sellers across business, personal growth, and the humanities. Includes unlimited reading time and Standard Read Aloud voice.
- Complete: Perfect for advanced learners and researchers needing full, unrestricted access. Unlock 1.4M+ books across hundreds of subjects, including academic and specialized titles. The Complete Plan also includes advanced features like Premium Read Aloud and Research Assistant.
We are an online textbook subscription service, where you can get access to an entire online library for less than the price of a single book per month. With over 1 million books across 1000+ topics, we’ve got you covered! Learn more here.
Look out for the read-aloud symbol on your next book to see if you can listen to it. The read-aloud tool reads text aloud for you, highlighting the text as it is being read. You can pause it, speed it up and slow it down. Learn more here.
Yes! You can use the Perlego app on both iOS or Android devices to read anytime, anywhere — even offline. Perfect for commutes or when you’re on the go.
Please note we cannot support devices running on iOS 13 and Android 7 or earlier. Learn more about using the app.
Yes, you can access From Big Data to Smart Data by Fernando Iafrate in PDF and/or ePUB format, as well as other popular books in Computer Science & Information Technology. We have over one million books available in our catalogue for you to explore.
Information
1
What is Big Data?
- 1) A “marketing” approach derived from technology that the information technologies (IT) industry (and its associated players) comes up on a regular basis.
- 2) A reality we felt coming for a long time in the world of business (mostly linked to the growth of the Internet), but that did not yet have a name.
- 3) The formalization of a phenomenon that has existed for many years, but that has intensified with the growing digitalization of our world.
The answer is undoubtedly all three at the same time. The volume of available data continues to grow, and it grows in different formats, whereas the cost of storage continues to fall (see Figure 1.1), making it very simple to store large quantities of data. Processing this data (its volume and its format), however, is another problem altogether. Big Data (in its technical approach) is concerned with data processing; Smart Data is concerned with analysis, value and integrating Big Data into business decision-making processes.
Big Data should be seen as new data sources that the business needs to integrate and correlate with the data it already has, and not as a concept (and its associated solutions) that seeks to replace Business Intelligence (BI). Big Data is an addition to and completes the range of solutions businesses have implemented for data processing, use and distribution to shed light on their decision-making, whether it is for strategic or operational ends.

Figure 1.1. In 1980, 20 GB of storing space weighed 1.5 tons and cost $1M; today 32 GB weighs 20 g and costs less than €20
Technological evolutions have opened up new horizons for data storage and management, enabling anything and everything to be stored at a highly competitive price (taking into account the volume and the fact the data have very little structure, such as photographs, videos, etc.). A greater difficulty is getting value from this data, due to the “noise” generated by the data that has not been processed prior to the storage process (too much data “kills” data); this is a disadvantage. A benefit, however, is that “raw” data storage opens (or at least does not close) the door to making new discoveries from “source” data. This would not have been possible if the data had been processed and filtered before storage. It is therefore a good idea to arbitrate between these two axes, following the objectives that will have been set.
1.1. The four “V”s characterizing Big Data
Big Data is the “data” principally characterized by the four “V”s. They are Volume, Variety, Velocity and Value (associated with Smart Data).
1.1.1. V for “Volume”
In 2014, three billion Internet users connected to the Internet using over six billion objects (which are mainly servers, personal computers (PCs), tablets and smartphones) using an Internet Protocol (IP) address (a “unique” identifier that enables a connected object to be uniquely identified and therefore to enable communication with its peers, which are mainly smartphones, tablets and computers). This generated about eight exabytes (10 to the power of 18 = a billion) for 2014 alone. A byte is a sequence of eight bits (the bit is the basic unit in IT, represented by zero or one) and enables information to be digitalized. In the very near future (see Figure 1.2) and with the advent of connected objects (everyday objects such as televisions, domestic appliances and security cameras that will be connected to the Internet), it is predicted that there will be several tens of billions. We are talking somewhere in the region of 50 billion, which will be able to generate more than 40,000 exabytes (40,000 billion of billion bytes) of data a year. The Internet is, after all, full of words and billions of events occur every minute. Some may have value for or be relevant to a business, others less so. Therefore, to find out which have value, it is necessary to read them, sort them, in short, “reduce” the data by sending the data through a storage, filtering, organization and then analysis zone (see section 1.2).

Figure 1.2. Research by the IDC on the evolution of digital data between 2010 and 2020
(source: http://www.emc.com/collateral/analyst-reports/idc-the-digital-universe-in-2020.pdf)
The main reason for this exponential evolution will be connected objects. We expect there to be approximately 400 times the current annual volume in 2020.
1.1.2. V for “Variety”
For a long time, we only processed data that had a good structure, often from transaction systems. Once the data had been extracted and transformed, it was put into what are called decision-support databases. These databases differ from others by the data model (the way data are stored and the relationships between data):
- – Transaction data model:
This model (structure of data storage and management) focuses on the execution speed of reading, writing and data modification actions to minimize the duration of a transaction to the lowest possible time (response time) and maximize the number of actions that can be conducted in parallel (scalability, e.g. an e-commerce site must be able to support thousands of Internet users who simultaneously access a catalog containing the products available and their prices via very selective criteria, which require little or no access to historical data). In this case, it is defined as a “normalized” data model, which organizes data structures into types, entities (e.g. client data are stored in a different structure to product data, invoice data, etc.), resulting in little or no data redundancy. In contrast, during the data query, we have to manage the countless and often complex, relations, joints between these entities (excellent knowledge of the data model is required, and these actions are delegated to solutions and applications and are very scarcely executed by a business analyst as they are much too complex).
In sum, the normalized model enables transaction activities to run efficiently, but makes implementing BI solutions and operational reporting (little or no space for analysis) difficult to implement directly on the transactional data model. To mitigate this issue, the operational data store (ODS) was put in place to implement some of the data tables (sourced from the transactional database) to an operational reporting database, with a more simple (light) data model. BI tools enabled a semantic layer (metadata) to be implemented, signaling a shift from a technical to a business view of the data, thereby allowing analysts to create reports without any knowledge of the physical data model.

Figure 1.3. (Normalized) transaction data model
- – Decision data model:
Table of contents
- Cover
- Table of Contents
- Preface
- List of Figures and Tables
- Introduction
- 1 What is Big Data?
- 2 What is Smart Data?
- 3 Zero Latency Organization
- 4 Summary by Example
- Conclusion
- Bibliography
- Glossary
- Index
- End User License Agreement