An integrated, strategic approach to higher-value analytics
Leaders and Innovators: How Data-Driven Organizations Are Winning with Analytics shows how businesses leverage enterprise analytics to gain strategic insights for profitability and growth. The key factor is integrated, end-to-end capabilities that encompass data management and analytics from a business and IT perspective; with analytics running inside a database where the data reside, everyday analytical processes become streamlined and more efficient. This book shows you what analytics is, what it can do, and how you can integrate old and new technologies to get more out of your data. Case studies and examples illustrate real-world scenarios in which an optimized analytics system revolutionized an organization's business. Using in-database and in-memory analytics along with Hadoop, you'll be equipped to improve performance while reducing processing time from days or weeks to hours or minutes. This more strategic approach uncovers the opportunities hidden in your data, and the detailed guidance to optimal data management allows you to break through even the biggest data challenges.
With data coming in from every angle in a constant stream, there has never been a greater need for proactive and agile strategies to overcome these struggles in a volatile and competitive economy. This book provides clear guidance and an integrated strategy for organizations seeking greater value from their data and becoming leaders and innovators in the industry.
Streamline analytics processes and daily tasks
Integrate traditional tools with new and modern technologies
Evolve from tactical to strategic behavior
Explore new analytics methods and applications
The depth and breadth of analytics capabilities, technologies, and potential makes it a bottomless well of insight. But too many organizations falter at implementation—too much, not enough, or the right amount in the wrong way all fail to deliver what an optimized and integrated system could. Leaders and Innovators: How Data-Driven Organizations Are Winning with Analytics shows you how to create the system your organization needs to dramatically improve performance, increase profitability, and drive innovation at all levels for the present and future.
Trusted by 375,005 students
Access to over 1.5 million titles for a fair monthly price.
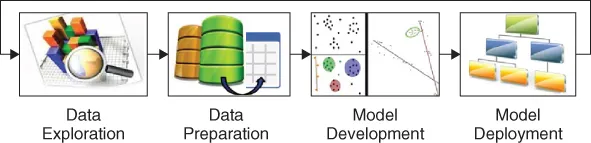
Like all things, there is a beginning and an ending in every journey. The same can be said about your data. Thus, all data have a life cycle—from inception to end of life and the analytical data life cycle is no different. In my interactions with customers, they tend to relate to four stages (data exploration, data preparation, model development, and model deployment) as the framework for managing the analytical data life cycle. Each stage is critical, as it supports the entire life cycle linearly. For example, model development cannot happen effectively if you do not prepare and explore the data beforehand. Figure 1.1 illustrates the analytical data life cycle.
Figure 1.1 Analytical data life cycle
Each phase of the lifecycle requires a specific role within the organization. For example, the IT's role is to get all data in one place. Business analysts step in during the data exploration and data preparation processes. Data scientists, data modelers, and statisticians are often involved in the model development stage. Finally, business analysts and/or IT can be a part of the model deployment process. Let's examine each stage of the analytical data life cycle.
STAGE 1: DATA EXPLORATION
The first and very critical stage is data exploration. Data exploration is the process that summarizes the characteristics of the data and extracts knowledge from the data. This process is typically conducted by a business analyst who wants to explore:
What the data look like
What variables are in the data set
Whether there are any missing observations
How the data are related
What are some of the data patterns
Does the data fit with other data being explored?
Do you have all of the data that you need for analysis?
An initial exploration of the data helps to explain these common inquiries. It also permits analysts to become more familiar and intimate with the data that they want to analyze.
The data exploration process normally involves a data visualization tool. In recent years, data visualization tools have become very popular among business analysts for data exploration purposes because they provide an eye-catching user interface that allows users to quickly and easily view most of the important features of the data. From this step, users can identify variables that are likely good candidates to explore and provide value to the other data that you are interested in for analysis. Data visualization tools offer many attractive features, and one of them is the ability to display the data graphically—for example, scatter plots or bar charts/pie charts. With the graphical displays of the data, users can determine if two or more variables correlate and whether they are relevant for further in-depth analysis.
The data exploration stage is critical. Customers who have opted to skip this stage tend to experience many issues in the later phases of the analytical life cycle. One of the best practices is to explore all your data directly in the database that allows the users to know the data before extracting for analysis, eliminate redundancy, and remove irrelevant data for analytics. The ability to quickly extract knowledge from large complex data sets provides an advantage for the data preparation stage.
STAGE 2: DATA PREPARATION
The second stage of the analytical life cycle is data preparation. Data preparation is the process of collecting, integrating, and aggregating the data into one file or data table for use in analytics. This process can be very tedious and cumbersome due some of the following challenges:
Combining data from numerous sources
Handling inconsistent or nonstandardized data
Cleaning dirty data
Integrating data that was manually entered
Dealing with structured and semistructured data
Value of the data
Customers that I have dealt with spend as much as 85 percent of their time preparing the data in the stage of the life cycle. The data preparation normally involves an IT specialist working closely with a business analyst to thoroughly understand their data needs. They say that preparing data generally involves fixing any errors (typically from human and/or machine input), filling in nulls and/or incomplete data, and merging/joining data from various sources or data formats. These activities consume many resources and personnel hours.
Data preparation is often directed to harmonize, enrich, and standardize your data in the database. In a common scenario, you may have multiple values that are used in a data set to represent the same value. An example of this is seen with U.S. states—where various values may be commonly used to represent the same state. A state like North Carolina could be represented by “NC,” “N.C.,” “N. Carolina,”' or “North Carolina,” to name a few. A data preparation tool could be leveraged in this example to identify an incorrect number of distinctive values (in the case of U.S. states, a unique count greater than 50 would raise a flag, as there are only 50 states in the United States). These values would then need to be standardized to use only an acceptable or standard abbreviation or only full spelling in every row.
Data preparation creates the right data for the model development process. Without the right data, you may be developing an incomplete data model on which to make your decisions. In a worst-case scenario where you have the incorrect data for the analytic data model, you will get erroneous results that send you down the path of a devastating decision. Bringing all the data from different sources and ensuring that the data are cleansed and integrated are the core building blocks to a complete analytical data model for decision support.
STAGE 3: MODEL DEVELOPMENT
Now that you have explored and prepared the data, it is time to develop the analytical data model. Before discussing the model development cycle, it is worthwhile to provide business pains faced by many organizations that develop a large number of analytical data models. Data models can take days, weeks, and even months to complete. The complexity is due to the availability of the data, the time it takes to generate the analytical data model, and the fact that models can be too large to maintain and in a constant state of decay.
To add to the complexity, model development involves many team members—data modelers, data architects, data scientists, business analyst, validation testers, and model scoring officers. Many organizations are challenged with the process of signing off on the development, validation, storage, and retirement of the data model. Model decay is another challenge that organizations encounter, so they need to constantly know how old the model is, who developed the model, and who is using the model for what application. The ability to version-control the model over time is another critical business need that includes event logging, tracking changes to the data attributes, and understanding how the model form and usage evolve over time. It also addresses what to do with the retired models—possibly archiving them for auditability, traceability, and regulatory compliance.
The use of an analytical data model varies from customer to customer. It is dependent on the industry or vertical that you are in; for example, you might have to adhere to regulations such as Sarbanes-Oxley or Basel II. Customers commonly leverage their analytical data models to examine
Customer retention
Customer attrition/churn
Marketing response
Consumer loyalty and offers
Fraud detection
Credit scoring
Risk management
Lifetime value
Path to purchase
Drug development
Clinical trials
Anti-money laundering
Demand forecasting
Loss prevention
If you are in the banking/financial industry, you may develop a data model that looks at time since last payment, number of missed payments, ratio of accrued interest, or formal loan cancellation to analyze risk of a loan default application. For retail and telecommunications, you may want to develop a data model that looks at customer acquisition/churn and cross-sell opportunities that rely on response to previous promotions within some time period and/or through some channels to enhance customer experience. Regardless of the data model type or industry, the data used in the analytical data model must be up to date and available during the lifetime of the model development and scoring processes.
Analytical data models have the ability to uncover hidden opportunities and are considered to be the fundamental success of a business. The use of analytics is increasing at an exponential rate, and organizations are developing analytical data models to enable data-driven decisions. Once models are built, deploying the models provides the outputs (resu...
Table of contents
Cover
Title Page
Copyright
Table of Contents
Dedication
Foreword
Acknowledgments
About the Author
Introduction
Chapter 1: The Analytical Data Life Cycle
Chapter 2: In-Database Processing
Chapter 3: In-Memory Analytics
Chapter 4: Hadoop
Chapter 5: Bringing It All Together
Chapter 6: Final Thoughts and Conclusion
Afterword
Index
End User License Agreement
Frequently asked questions
Yes, you can cancel anytime from the Subscription tab in your account settings on the Perlego website. Your subscription will stay active until the end of your current billing period. Learn how to cancel your subscription
No, books cannot be downloaded as external files, such as PDFs, for use outside of Perlego. However, you can download books within the Perlego app for offline reading on mobile or tablet. Learn how to download books offline
Perlego offers two plans: Essential and Complete
Essential is ideal for learners and professionals who enjoy exploring a wide range of subjects. Access the Essential Library with 800,000+ trusted titles and best-sellers across business, personal growth, and the humanities. Includes unlimited reading time and Standard Read Aloud voice.
Complete: Perfect for advanced learners and researchers needing full, unrestricted access. Unlock 1.5M+ books across hundreds of subjects, including academic and specialized titles. The Complete Plan also includes advanced features like Premium Read Aloud and Research Assistant.
Both plans are available with monthly, semester, or annual billing cycles.
We are an online textbook subscription service, where you can get access to an entire online library for less than the price of a single book per month. With over 1.5 million books across 990+ topics, we’ve got you covered! Learn about our mission
Look out for the read-aloud symbol on your next book to see if you can listen to it. The read-aloud tool reads text aloud for you, highlighting the text as it is being read. You can pause it, speed it up and slow it down. Learn more about Read Aloud
Yes! You can use the Perlego app on both iOS and Android devices to read anytime, anywhere — even offline. Perfect for commutes or when you’re on the go. Please note we cannot support devices running on iOS 13 and Android 7 or earlier. Learn more about using the app
Yes, you can access Leaders and Innovators by Tho H. Nguyen in PDF and/or ePUB format, as well as other popular books in Business & Decision Making. We have over 1.5 million books available in our catalogue for you to explore.