A Practical Guide to Exploratory Data Analysis and Data Mining
Glenn J. Myatt, Wayne P. Johnson
This is a test
This is a test
Share book
English
ePUB (mobile friendly)
Available on iOS & Android
eBook - ePub
Making Sense of Data I
A Practical Guide to Exploratory Data Analysis and Data Mining
Glenn J. Myatt, Wayne P. Johnson
Book details
Book preview
Table of contents
Citations
About This Book
Praise for the First Edition
"...a well-written book on data analysis and data mining that provides an excellent foundation..."
—CHOICE
"This is a must-read book for learning practical statistics and data analysis..."
—Computing Reviews.com
A proven go-to guide for data analysis, Making Sense of Data I: A Practical Guide to Exploratory Data Analysis and Data Mining, Second Edition focuses on basic data analysis approaches that are necessary to make timely and accurate decisions in a diverse range of projects. Based on the authors' practical experience in implementing data analysis and data mining, the new edition provides clear explanations that guide readers from almost every field of study.
In order to facilitate the needed steps when handling a data analysis or data mining project, a step-by-step approach aids professionals in carefully analyzing data and implementing results, leading to the development of smarter business decisions. The tools to summarize and interpret data in order to master data analysis are integrated throughout, and the Second Edition also features:
Updated exercises for both manual and computer-aided implementation with accompanying worked examples
New appendices with coverage on the freely available Traceis™ software, including tutorials using data from a variety of disciplines such as the social sciences, engineering, and finance
New topical coverage on multiple linear regression and logistic regression to provide a range of widely used and transparent approaches
Additional real-world examples of data preparation to establish a practical background for making decisions from data
Making Sense of Data I: A Practical Guide to Exploratory Data Analysis and Data Mining, Second Edition is an excellent reference for researchers and professionals who need to achieve effective decision making from data. The Second Edition is also an ideal textbook for undergraduate and graduate-level courses in data analysis and data mining and is appropriate for cross-disciplinary courses found within computer science and engineering departments.
Frequently asked questions
How do I cancel my subscription?
Simply head over to the account section in settings and click on “Cancel Subscription” - it’s as simple as that. After you cancel, your membership will stay active for the remainder of the time you’ve paid for. Learn more here.
Can/how do I download books?
At the moment all of our mobile-responsive ePub books are available to download via the app. Most of our PDFs are also available to download and we're working on making the final remaining ones downloadable now. Learn more here.
What is the difference between the pricing plans?
Both plans give you full access to the library and all of Perlego’s features. The only differences are the price and subscription period: With the annual plan you’ll save around 30% compared to 12 months on the monthly plan.
What is Perlego?
We are an online textbook subscription service, where you can get access to an entire online library for less than the price of a single book per month. With over 1 million books across 1000+ topics, we’ve got you covered! Learn more here.
Do you support text-to-speech?
Look out for the read-aloud symbol on your next book to see if you can listen to it. The read-aloud tool reads text aloud for you, highlighting the text as it is being read. You can pause it, speed it up and slow it down. Learn more here.
Is Making Sense of Data I an online PDF/ePUB?
Yes, you can access Making Sense of Data I by Glenn J. Myatt, Wayne P. Johnson in PDF and/or ePUB format, as well as other popular books in Mathématiques & Probabilités et statistiques. We have over one million books available in our catalogue for you to explore.
Almost every discipline from biology and economics to engineering and marketing measures, gathers, and stores data in some digital form. Retail companies store information on sales transactions, insurance companies keep track of insurance claims, and meteorological organizations measure and collect data concerning weather conditions. Timely and well-founded decisions need to be made using the information collected. These decisions will be used to maximize sales, improve research and development projects, and trim costs. Retail companies must determine which products in their stores are under- or over-performing as well as understand the preferences of their customers; insurance companies need to identify activities associated with fraudulent claims; and meteorological organizations attempt to predict future weather conditions.
Data are being produced at faster rates due to the explosion of internet-related information and the increased use of operational systems to collect business, engineering and scientific data, and measurements from sensors or monitors. It is a trend that will continue into the foreseeable future. The challenges of handling and making sense of this information are significant because of the increasing volume of data, the complexity that arises from the diverse types of information that are collected, and the reliability of the data collected.
The process of taking raw data and converting it into meaningful information necessary to make decisions is the focus of this book. The following sections in this chapter outline the major steps in a data analysis or data mining project from defining the problem to the deployment of the results. The process provides a framework for executing projects related to data mining or data analysis. It includes a discussion of the steps and challenges of (1) defining the project, (2) preparing data for analysis, (3) selecting data analysis or data mining approaches that may include performing an optimization of the analysis to refine the results, and (4) deploying and measuring the results to ensure that any expected benefits are realized. The chapter also includes an outline of topics covered in this book and the supporting resources that can be used alongside the book's content.
1.2 SOURCES OF DATA
There are many different sources of data as well as methods used to collect the data. Surveys or polls are valuable approaches for gathering data to answer specific questions. An interview using a set of predefined questions is often conducted over the phone, in person, or over the internet. It is used to elicit information on people's opinions, preferences, and behavior. For example, a poll may be used to understand how a population of eligible voters will cast their vote in an upcoming election. The specific questions along with the target population should be clearly defined prior to the interviews. Any bias in the survey should be eliminated by selecting a random sample of the target population. For example, bias can be introduced in situations where only those responding to the questionnaire are included in the survey, since this group may not be representative of a random sample of the entire population. The questionnaire should not contain leading questions—questions that favor a particular response. Other factors which might result in segments of the total population being excluded should also be considered, such as the time of day the survey or poll was conducted. A well-designed survey or poll can provide an accurate and cost-effective approach to understanding opinions or needs across a large group of individuals without the need to survey everyone in the target population.
Experiments measure and collect data to answer specific questions in a highly controlled manner. The data collected should be reliably measured; in other words, repeating the measurement should not result in substantially different values. Experiments attempt to understand cause-and-effect phenomena by controlling other factors that may be important. For example, when studying the effects of a new drug, a double-blind study is typically used. The sample of patients selected to take part in the study is divided into two groups. The new drug is delivered to one group, whereas a placebo (a sugar pill) is given to the other group. To avoid a bias in the study on the part of the patient or the doctor, neither the patient nor the doctor administering the treatment knows which group a patient belongs to. In certain situations it is impossible to conduct a controlled experiment on either logistical or ethical grounds. In these situations a large number of observations are measured and care is taken when interpreting the results. For example, it would not be ethical to set up a controlled experiment to test whether smoking causes health problems.
As part of the daily operations of an organization, data is collected for a variety of reasons. Operational databases contain ongoing business transactions and are accessed and updated regularly. Examples include supply chain and logistics management systems, customer relationship management databases (CRM), and enterprise resource planning databases (ERP). An organization may also be automatically monitoring operational processes with sensors, such as the performance of various nodes in a communications network. A data warehouse is a copy of data gathered from other sources within an organization that is appropriately prepared for making decisions. It is not updated as frequently as operational databases. Databases are also used to house historical polls, surveys, and experiments. In many cases data from in-house sources may not be sufficient to answer the questions now being asked of it. In these cases, the internal data can be augmented with data from other sources such as information collected from the web or literature.
1.3 PROCESS FOR MAKING SENSE OF DATA
1.3.1 Overview
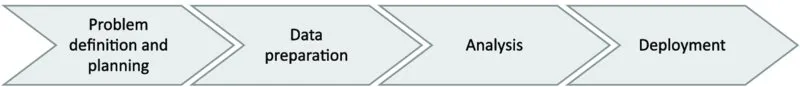
Following a predefined process will ensure that issues are addressed and appropriate steps are taken. For exploratory data analysis and data mining projects, you should carefully think through the following steps, which are summarized here and expanded in the following sections:
Problem definition and planning: The problem to be solved and the projected deliverables should be clearly defined and planned, and an appropriate team should be assembled to perform the analysis.
Data preparation: Prior to starting a data analysis or data mining project, the data should be collected, characterized, cleaned, transformed, and partitioned into an appropriate form for further processing.
Analysis: Based on the information from steps 1 and 2, appropriate data analysis and data mining techniques should be selected. These methods often need to be optimized to obtain the best results.
Deployment: The results from step 3 should be communicated and/or deployed to obtain the projected benefits identified at the start of the project.
Figure 1.1 summarizes this process. Although it is usual to follow the order described, there will be interactions between the different steps that may require work completed in earlier phases to be revised. For example, it may be necessary to return to the data preparation (step 2) while implementing the data analysis (step 3) in order to make modifications based on what is being learned.
FIGURE 1.1 Summary of a general framework for a data analysis project.
1.3.2 Problem Definition and Planning
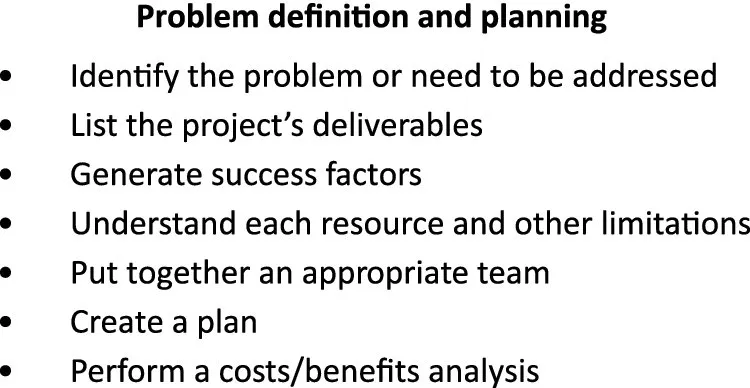
The first step in a data analysis or data mining project is to describe the problem being addressed and generate a plan. The following section addresses a number of issues to consider in this first phase. These issues are summarized in Figure 1.2.
FIGURE 1.2 Summary of some of the issues to consider when defining and planning a data analysis project.
It is important to document the business or scientific problem to be solved along with relevant background information. In certain situations, however, it may not be possible or even desirable to know precisely the sort of information that will be generated from the project. These more open-ended projects will often generate questions by exploring large databases. But even in these cases, identifying the business or scientific problem driving the analysis will help to constrain and focus the work. To illustrate, an e-commerce company wishes to embark on a project to redesign their website in order to generate additional revenue. Before starting this potentially costly project, the organization decides to perform data analysis or data mining of available web-related information. The results of this analysis will then be used to influence and prioritize this redesign. A general problem statement, such as “make recommendations to improve sales on the website,” along with relevant background information should be documented.
This broad statement of the problem is useful as a headline; however, this description should be divided into a series of clearly defined deliverables that ultimately solve the broader issue. These include: (1) categorize website users based on demographic information; (2) categorize users of the website based on browsing patterns; and (3) determine if there are any relationships between these demographic and/or browsing patterns and purchasing habits. This information can then be used to tailor the site to specific groups of users or improve how their customers purchase based on the usage patterns found in the analysis. In addition to understanding what type of information will be generated, it is also useful to know how it will be delivered. Will the solution be a report, a computer program to be used for making predictions, or a set of business rules? Defining these deliverables will set the expectations for those working on the project and for its stakeholders, such as the management sponsoring the project.
The success criteria related to the project's objective should ideally be defined in ways that can be measured. For example, a criterion might be to increase revenue or reduce costs by a specific amount. This type of criteria can often be directly related to the performance level of a computational model generated from the data. For example, when developing a computational model that will be used to make numeric projections, it is useful to understand the required level of accuracy. Understanding this will help prioritize the types of methods adopted or the time or approach used in optimizations. For example, a credit card company that is l...