
eBook - ePub
Bioinformatics and Molecular Evolution
Paul G. Higgs, Teresa K. Attwood
This is a test
Buch teilen
- English
- ePUB (handyfreundlich)
- Über iOS und Android verfügbar
eBook - ePub
Bioinformatics and Molecular Evolution
Paul G. Higgs, Teresa K. Attwood
Angaben zum Buch
Buchvorschau
Inhaltsverzeichnis
Quellenangaben
Über dieses Buch
In the current era of complete genome sequencing, Bioinformatics and Molecular Evolution provides an up-to-date and comprehensive introduction to bioinformatics in the context of evolutionary biology.
This accessible text:
- provides a thorough examination of sequence analysis, biological databases, pattern recognition, and applications to genomics, microarrays, and proteomics
- emphasizes the theoretical and statistical methods used in bioinformatics programs in a way that is accessible to biological science students
- places bioinformatics in the context of evolutionary biology, including population genetics, molecular evolution, molecular phylogenetics, and their applications
- features end-of-chapter problems and self-tests to help students synthesize the materials and apply their understanding
- is accompanied by a dedicated website - www.blackwellpublishing.com/higgs - containing downloadable sequences, links to web resources, answers to self-test questions, and all artwork in downloadable format (artwork also available to instructors on CD-ROM).
This important textbook will equip readers with a thorough understanding of the quantitative methods used in the analysis of molecular evolution, and will be essential reading for advanced undergraduates, graduates, and researchers in molecular biology, genetics, genomics, computational biology, and bioinformatics courses.
Häufig gestellte Fragen
Wie kann ich mein Abo kündigen?
Gehe einfach zum Kontobereich in den Einstellungen und klicke auf „Abo kündigen“ – ganz einfach. Nachdem du gekündigt hast, bleibt deine Mitgliedschaft für den verbleibenden Abozeitraum, den du bereits bezahlt hast, aktiv. Mehr Informationen hier.
(Wie) Kann ich Bücher herunterladen?
Derzeit stehen all unsere auf Mobilgeräte reagierenden ePub-Bücher zum Download über die App zur Verfügung. Die meisten unserer PDFs stehen ebenfalls zum Download bereit; wir arbeiten daran, auch die übrigen PDFs zum Download anzubieten, bei denen dies aktuell noch nicht möglich ist. Weitere Informationen hier.
Welcher Unterschied besteht bei den Preisen zwischen den Aboplänen?
Mit beiden Aboplänen erhältst du vollen Zugang zur Bibliothek und allen Funktionen von Perlego. Die einzigen Unterschiede bestehen im Preis und dem Abozeitraum: Mit dem Jahresabo sparst du auf 12 Monate gerechnet im Vergleich zum Monatsabo rund 30 %.
Was ist Perlego?
Wir sind ein Online-Abodienst für Lehrbücher, bei dem du für weniger als den Preis eines einzelnen Buches pro Monat Zugang zu einer ganzen Online-Bibliothek erhältst. Mit über 1 Million Büchern zu über 1.000 verschiedenen Themen haben wir bestimmt alles, was du brauchst! Weitere Informationen hier.
Unterstützt Perlego Text-zu-Sprache?
Achte auf das Symbol zum Vorlesen in deinem nächsten Buch, um zu sehen, ob du es dir auch anhören kannst. Bei diesem Tool wird dir Text laut vorgelesen, wobei der Text beim Vorlesen auch grafisch hervorgehoben wird. Du kannst das Vorlesen jederzeit anhalten, beschleunigen und verlangsamen. Weitere Informationen hier.
Ist Bioinformatics and Molecular Evolution als Online-PDF/ePub verfügbar?
Ja, du hast Zugang zu Bioinformatics and Molecular Evolution von Paul G. Higgs, Teresa K. Attwood im PDF- und/oder ePub-Format sowie zu anderen beliebten Büchern aus Ciencias biológicas & Biología celular. Aus unserem Katalog stehen dir über 1 Million Bücher zur Verfügung.
Information
CHAPTER 1
Introduction: The revolution in biological information
CHAPTER PREVIEW
Here we consider the rapid expansion in the amount of biological sequence data available and compare this to the exponential growth in computer speed and memory size that has occurred in the same period. The reader should appreciate why bioinformatics is now essential for understanding the information contained in the sequences, and for efficient storage and retrieval of the information. We also consider some of the history of bioinformatics, and show that many of its foundations are related to molecular evolution and population genetics. Thus, the reader should understand what is meant by the term “bioinformatics” and the role of bioinformatics in relation to other disciplines.
1.1 DATA EXPLOSIONS
In the past decade there has been an explosion in the amount of DNA sequence data available, due to the very rapid progress of genome sequencing projects. There are three principal comprehensive databases of nucleic acid sequences in the world today.
- The EMBL (European Molecular Biology Laboratory) database is maintained at the European Bioinformatics Institute in Cambridge, UK (Stoesser et al. 2003).
- GenBank is maintained at the National Center for Biotechnology Information in Maryland, USA (Benson et al. 2003).
- The DDBJ (DNA Databank of Japan) is maintained at the National Institute of Genetics in Mishima, Japan (Miyazaki et al. 2003).
These three databases share information and hence contain almost identical sets of sequences. The objective of these databases is to ensure that DNA sequence information is stored in a way that is publicly, and freely, accessible and that it can be retrieved and used by other researchers in the future. Most scientific journals require submission of newly sequenced DNA to one of the public databases before a publication can be made that relies on the sequence. This policy has proved tremendously successful for the progress of science, and has led to a rapid increase in the size and usage of sequence databases.
As a measure of the rapid increase in the total available amount of sequence data, Fig. 1.1 and Table 1.1 show the total length of all sequences in GenBank, and the total number of sequences in GenBank as a function of time. Note that the vertical scale is logarithmic and the curves appear approximately as straight lines. This means that the size of GenBank is increasing exponentially with time (see Problem 1.1). The dotted line in the figure is a straight-line fit to the data for the total sequence length (the 1982 point seemed to be an outlier and was excluded). From this we can estimate that the yearly multiplication factor (i.e., the factor by which the amount of data goes up each year) is about 1.6, and that the database doubles in size every 1.4 years. All those sequencing machines are working hard! Interestingly, the curve for the number of sequences almost exactly parallels the curve for the total length. This means that the typical length of one sequence entry in GenBank has remained at close to 1000. There are, of course, enormous variations in length between different sequence entries.
Fig. 1.1 Comparison of the rate of growth of the GenBank sequence (data from Table 1.1) with the rate of growth of the number of transistors in personal computer chips (Moore’s law: data from Table 1.2). Dashed lines are fits to an exponential growth law.
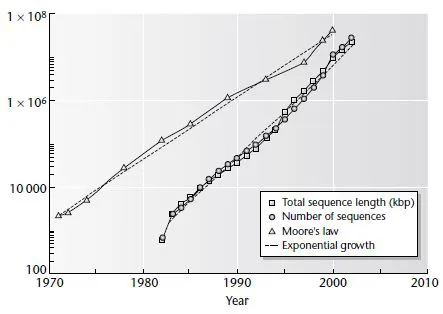
Table 1.1 The growth of GenBank.
| Year | Base pairs | Sequences |
| 1982 | 680,338 | 606 |
| 1983 | 2,274,029 | 2,427 |
| 1984 | 3,368,765 | 4,175 |
| 1985 | 5,204,420 | 5,700 |
| 1986 | 9,615,371 | 9,978 |
| 1987 | 15,514,776 | 14,584 |
| 1988 | 23,800,000 | 20,579 |
| 1989 | 34,762,585 | 28,791 |
| 1990 | 49,179,285 | 39,533 |
| 1991 | 71,947,426 | 55,627 |
| 1992 | 101,008,486 | 78,608 |
| 1993 | 157,152,442 | 143,492 |
| 1994 | 217,102,462 | 215,273 |
| 1995 | 384,939,485 | 555,694 |
| 1996 | 651,972,984 | 1,021,211 |
| 1997 | 1,160,300,687 | 1,765,847 |
| 1998 | 2,008,761,784 | 2,837,897 |
| 1999 | 3,841,163,011 | 4,864,570 |
| 2000 | 11,101,066,288 | 10,106,023 |
| 2001 | 15,849,921,438 | 14,976,310 |
| 2002 | 28,507,990,166 | 22,318,883 |
Data obtained from www.ncbi.nih.gov/Genbank/genbankstats.html.
There is another famous exponentially increasing curve that goes by the name of Moore’s law. Moore (1965) noticed that the number of transistors in integrated circuits appeared to be roughly doubling every year over the period 1959–65. Data on the size of Intel PC chips (Table 1.2) show that this exponential increase is still continuing. Looking at the data more carefully, however, we see that the estimate of doubling every year is rather overoptimistic. The chip size is actually doubling every two years and the yearly multiplication factor is 1.4. Although extremely impressive, this is substantially slower than the rate of increase of GenBank (see Fig. 1.1 and Table 1.3).
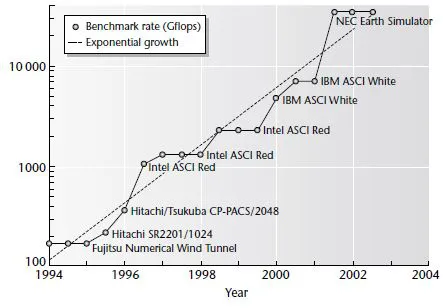
What about the world’s fastest supercomputers? Jack Dongarra and colleagues from the University of Tennessee introduced the LINPACK benchmark, which measures the speed of computers at solving a complex set of linear equations. A list of the top 500 supercomputers according to this benchmark is published twice yearly (http://www.top500.org). Figure 1.2 shows the performance benchmark rate of the top computer at each release of the list. Once again, this is approximately an exponential (with large fluctuations). The best-fit straight line has a doubling time of 1.04 years. So supercomputers seem to be beating GenBank for the moment. However, most of us do not have access to a supercomputer. The PC chip size may be a better measure of the amount of computing power available to anyone using a desktop.
Table 1.2 The growth of the number of transistors in personal computer processors.
| Type of processor | Year of introduction | Transistors |
| 4004 | 1971 | 2,250 |
| 8008 | 1972 | 2,500 |
| 8080 | 1974 | 5,000 |
| 8086 | 1978 | 29,000 |
| 286 | 1982 | 120,000 |
| 386™ processor | 1985 | 275,000 |
| 486™ DX processor | 1989 | 1,180,000 |
| Pentium® processor | 1993 | 3,100,000 |
| Pentium II processor | 1997 | 7,500,000 |
| Pentium III processor | 1999 | 24,000,000 |
| Pentium 4 processor | 2000 | 42,000,000 |
Data obtained from Intel (http://www.intel.com/research/silicon/mooreslaw.htm).
Fig. 1.2 The performance of the world’s top supercomputers using the LINPACK benchmark (Gflops). Data from http://www.top500.org.
Clearly, we have reached a point where computers are essential for the storage, retrieval, and analysis of biological sequence data. However, we cannot simply rely on computers and stop thinking. If we stick with our same old computing methods, then we will be limited by the hardware. We still need people, because only people can think of better and faster algorithms for data analysis. That is what this book is about. We will discuss the methods and algorithms used in bioinformatics, so that hopefully you will understand enough to be able to improve those methods yourself.
Another important type of biological data that is exponentially increasing is protein structures. PDB is a database of protein structures obtained from X-ray crystallography and NMR experiments. From the number of entries in PDB in successive releases, we calculated that the doubling time for the number of available protein structures is 3.31 years (Table 1.3), which is considerably slower than the number of sequences. Since the number of experimentally determined structures is lagging further and further behind the number of sequences, computational methods for structure prediction are important. Many of these methods work by looking for similarities in sequence between a protein of unknown structure and a protein of known structure, and use this to make predictions about the unknown structure. These techniques will become increasingly useful as our knowledge of real examples increases.
Table 1.3 Comparison of rates of increase of several different data explosion curves.
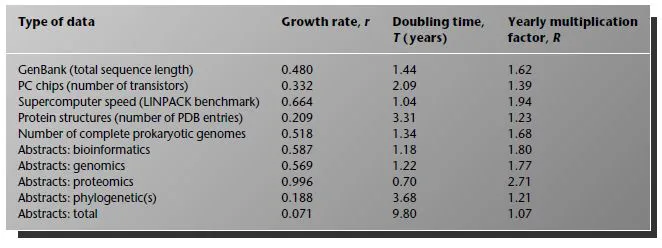
Table 1.4 The history of genome-sequencing projects.
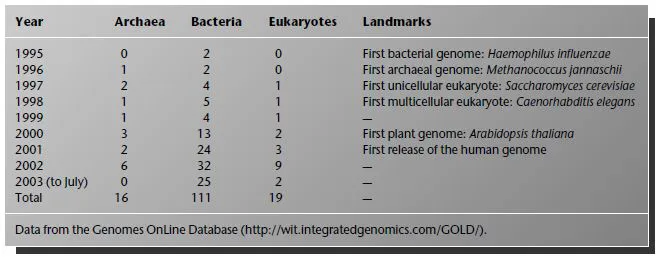
In 1995, the bacterium Haemophilus influenzae entered history as the first organism to have its genome completely sequenced. Sequencing technology has advanced rapidly and has become increasingly automated. The sequencing of a new prokaryotic genome has now become almost commonplace. Table 1.4 shows the progress of complete genome projects with some historical landmarks. With the publication of the human genome in 2001, we can now truly say that we are in the “post-genome age”. The number of complete prokaryotic genomes (total of archaea plus bacteria from Table 1.4) is going through its own data explosion. The doubling time is about 1.3 years and the yearly multiplication factor is about 1.7. For the present, complete eukaryotic genomes are still rather few, so that the publication of each individual genome still retains its status as a landmark event. It seems only a matter of time, however, before we shall be able to draw a data explosion curve for the number of eukaryotic genomes too.
This book emphasizes the relationship between bioinformatics and molecular evolution. The availability of complete genomes is tremendously important for evolutionary studies. For the first time we can begin to compare whole sets of genes between organisms, not just single genes. For the first time we can begin to study the processes that govern the evolution of whole genomes. This is therefore an exciting time to be in the bioinformatics area.
1.2 GENOMICS AND HIGH-THROUGHPUT TECHNIQUES
The availability of complete genomes has opened up a whole research discipline known as genomics. Genomics refers to scientific studies dealing with whole sets of genes rather than single genes. The advances made in sequencing technology have come at the same time as the appearance of new high-throughput experimental techniques. One of the most important of these is microarray technology, which allows measurement of the expression level (i.e., mRNA concentration) of thousands of genes in a cell simultaneously. For example, in the case of the yeast, Saccharomyces cerevisiae, where the complete genome is available, we can put probes for all the genes onto one microarray chip. We can then study the way the expression levels of all the genes respond to changes in external conditions or the way that they vary during the cell cycle. Complete genomes therefore change the way that experimental science is carried out, and allow us to address questions that were not possible before.
Another important field where high-throughput techniques are used is proteomics. Proteomics is the study of the proteome, i.e., the complete set of proteins in a cell. The experimental techniques used are principally two-dimensional gel electrophoresis for the separation of the many different proteins in a cell extract, and mass spectrometry for identifying proteins by their molecular masses. Once again, the availability of complete genomes is tremendously important, because the masses of the proteins determined by mass spectrometry can be compared directly to the masses of proteins expected from the predicted position of open reading frames in the genome.
High-throughput experiments produce large amounts of quantitative data. This poses challenges for bioinformaticians. How do we store information from a microarray experiment in such a way that it can be compared with results from other groups? How do we best extract meaningful information from the vast array of numbers generated? New statistical methods are needed to spot significant trends and patterns in the data. This is a new area of biological sciences where computational methods are essential for the progress of the experimental science, and where algorithms and experimental techniques are being developed side by side.
As a measure of the interest of the scientific community in genomics and related areas, let us look at the number of scientific papers published in these areas over the past few years. The ISI Science Citation Index allows searches for articles published in specific years that use specified words in their title, keywords, or abstract. Figure 1.3 shows the numbers of published articles (cumulative since 1981) for several important terms relevant to this book. Papers using the words “genomics” and “bioinformatics” increase at almost exactly the same rate, both having yearly multiplication factors of 1.8 and doubling times of 1.2 years. “Proteomics” is a very young field, with no articles found prior to 1998. The doubling time is 0.7 years: the fastest growth of any of the quantities considered in Table 1.3. References to “microarray” also increase rapidly. This curve appears significantly nonlinear because there are several different meanings for the term. Almost all the references prior to about 1996 refer to microarray electrodes, whereas in later years, almost all refer to DNA microarrays for gene expression. The rate of increase of the use of DNA microarrays is therefore steeper than it appears in the figure.
The number of papers using both “sequence” and “database” is much larger than those using any of the terms considered above (although it is increasing less rapidly). This shows how important biological databases and the algorithms for searching them have become to th...