
eBook - ePub
Atomic Force Microscopy
Understanding Basic Modes and Advanced Applications
Greg Haugstad
This is a test
Buch teilen
- English
- ePUB (handyfreundlich)
- Über iOS und Android verfügbar
eBook - ePub
Atomic Force Microscopy
Understanding Basic Modes and Advanced Applications
Greg Haugstad
Angaben zum Buch
Buchvorschau
Inhaltsverzeichnis
Quellenangaben
Über dieses Buch
This bookenlightens readers onthe basic surface properties and distance-dependent intersurface forces one must understand to obtain even simple data from an atomic force microscope (AFM). The material becomes progressively more complex throughout the book, explaining details of calibration, physical origin of artifacts, and signal/noise limitations. Coverage spans imaging, materials property characterization, in-liquid interfacial analysis, tribology, and electromagnetic interactions.
"Supplementary material for this book can be found by entering ISBN 9780470638828 on booksupport.wiley.com"
Häufig gestellte Fragen
Wie kann ich mein Abo kündigen?
Gehe einfach zum Kontobereich in den Einstellungen und klicke auf „Abo kündigen“ – ganz einfach. Nachdem du gekündigt hast, bleibt deine Mitgliedschaft für den verbleibenden Abozeitraum, den du bereits bezahlt hast, aktiv. Mehr Informationen hier.
(Wie) Kann ich Bücher herunterladen?
Derzeit stehen all unsere auf Mobilgeräte reagierenden ePub-Bücher zum Download über die App zur Verfügung. Die meisten unserer PDFs stehen ebenfalls zum Download bereit; wir arbeiten daran, auch die übrigen PDFs zum Download anzubieten, bei denen dies aktuell noch nicht möglich ist. Weitere Informationen hier.
Welcher Unterschied besteht bei den Preisen zwischen den Aboplänen?
Mit beiden Aboplänen erhältst du vollen Zugang zur Bibliothek und allen Funktionen von Perlego. Die einzigen Unterschiede bestehen im Preis und dem Abozeitraum: Mit dem Jahresabo sparst du auf 12 Monate gerechnet im Vergleich zum Monatsabo rund 30 %.
Was ist Perlego?
Wir sind ein Online-Abodienst für Lehrbücher, bei dem du für weniger als den Preis eines einzelnen Buches pro Monat Zugang zu einer ganzen Online-Bibliothek erhältst. Mit über 1 Million Büchern zu über 1.000 verschiedenen Themen haben wir bestimmt alles, was du brauchst! Weitere Informationen hier.
Unterstützt Perlego Text-zu-Sprache?
Achte auf das Symbol zum Vorlesen in deinem nächsten Buch, um zu sehen, ob du es dir auch anhören kannst. Bei diesem Tool wird dir Text laut vorgelesen, wobei der Text beim Vorlesen auch grafisch hervorgehoben wird. Du kannst das Vorlesen jederzeit anhalten, beschleunigen und verlangsamen. Weitere Informationen hier.
Ist Atomic Force Microscopy als Online-PDF/ePub verfügbar?
Ja, du hast Zugang zu Atomic Force Microscopy von Greg Haugstad im PDF- und/oder ePub-Format sowie zu anderen beliebten Büchern aus Sciences physiques & Histoire et pratique des sciences. Aus unserem Katalog stehen dir über 1 Million Bücher zur Verfügung.
Information
Chapter 1
Overview of AFM
1.1 The Essence of the Technique
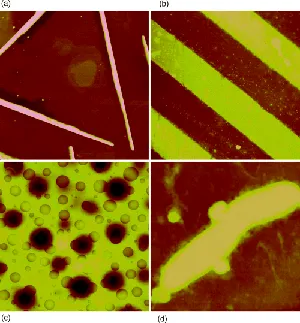
Atomic force microscopy or AFM is a method to see the shape of a surface in three-dimensional (3D) detail down to the nanometer scale [1,2]. AFM can image all materials—hard or soft, synthetic or natural (including biological structures such as cells and biomolecules)—irrespective of opaqueness or conductivity. The sample is usually imaged in air, but can be in liquid environments and in some cases under vacuum. The surface morphology is not perceived in the usual way, that is, by line-of-sight, reflections, or shadows.1 Rather, at each point or pixel within a 2D array over the surface, a measurement of surface height is made using a sharp solid force probe. One could thus say that AFM is “blind microscopy”; it essentially uses touch to image a surface, unlike light or electron microscopes. The force probe may move over a stationary sample or remain stationary as the sample is moved under the probe, as discussed in Chapter 4. Typically, one chooses to display the height measurements as colors or tints, some variant of dark-is-low/bright-is-high, with a gradient of color or grayscale in between. Thus, an image of surface topography is obtained for viewing purposes, as exemplified in Figure 1.1, for several surfaces relevant to hard and soft materials science, nanotechnology, and biology. The typical range of these measurements is several micrometers vertically with subnanometer height resolution and several tens of micrometers laterally, ranging up to ~100 μm, with a highest lateral resolution of ~1 nm (when not limited by the pixel density of the image, i.e., physical resolution as opposed to digital resolution).
Figure 1.1 In-air surface topography images of (a) silver rods (15-nm tall) grown from a AgBr(111) surface by photoreduction, 5 × 5 μm [3]; (b) gold and aluminum lines (~50-nm tall) lithographically created on silicon, 25 × 25 μm; (c) surface of a ~1-μm thick polymer film (deepest valleys ~100 nm) of a 75:25 blend of butyl and lauryl methacrylates (spin coated onto a silicon wafer), 8 × 8 μm; (d) wastewater bacterium (170-nm tall) on filtration membrane, 3 × 3 μm [4].
Given that the image is constructed from height numbers, one also can measure peak-to-valley distances, compute standard deviations of height, compile the distribution of heights or slopes of hills..., and even Fourier-analyze a surface to identify periodic components (ripples or lattices) or dominant length scales (akin to a scattering technique). These metrics of topography can be relevant to technological performance or biological function, whether in microelectronics (e.g., roughness of layers or grain size, in deposition processes), tribology (e.g., friction and wear on hard disk read heads), polymer–drug coatings (e.g., surface contour area impacting drug release rate), intrabody medical devices (e.g., shape of surface in contact with cells, tissues), cellular membranes and surface components (e.g., phospholipid bilayer, protein receptors), and much more.
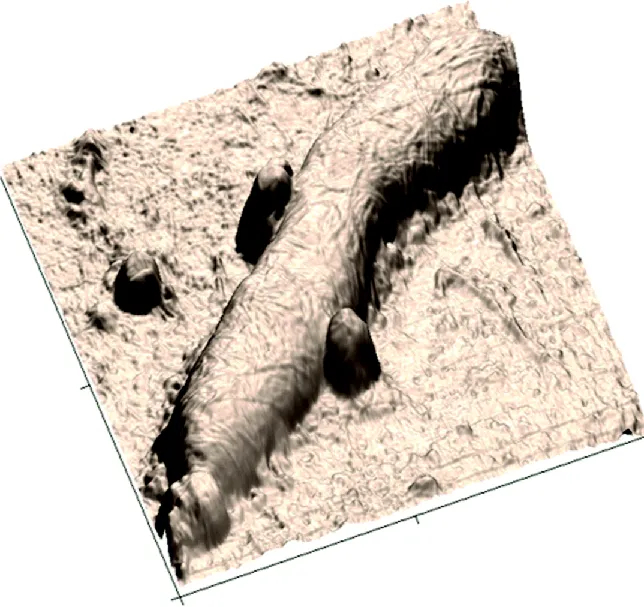
As a bonus, with real height numbers in hand, one can render images in 3D perspective. The example in Figure 1.2 is an image of the dividing bacterium rendered in 2D in Figure 1.1d. Computer-simulated light reflections and shadows are incorporated to give the sense of a macroscale object and to enhance the perception of texture, even though the features may be nanoscale (i.e., below the resolution of real light microscopes). The angle of simulated illumination as well as the angle of “view” can be adjusted. The vertical scale has been exaggerated; the height of the bacterium is 180 nm, but is made to appear almost twice that high in comparison to the lateral scale. This is typical; often 3D-rendered AFM images exaggerate height by an even greater factor to bring out features for viewing.2
Figure 1.2 Wastewater bacterium (170-nm tall) on filtration membrane, 3 × 3 μm.
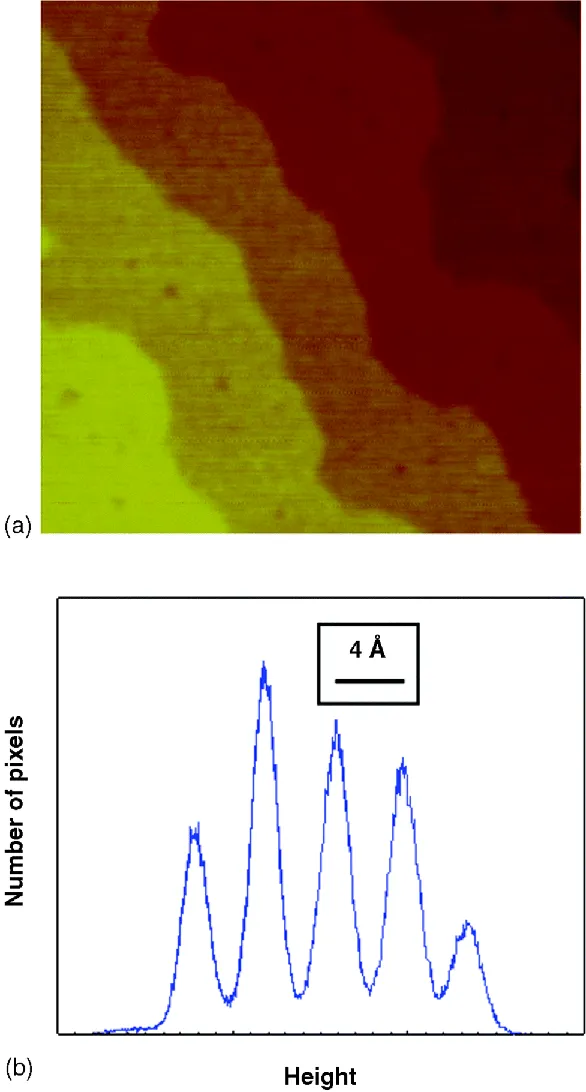
A bacterium, or for that matter anything hundreds of nanometers tall, is in fact a large object for AFM. With AFM's high precision, one can measure molecular or atomic crystal structures and indeed image striking, meandering steps. Figure 1.3 contains an image of five terraces on a surface of single crystal SrTiO3, in ambient air. The steps between terraces comprise a “staircase” of increasing brightness from top right to bottom left. Also shown is a histogram representation or population of heights in the image: the number of pixels counted within narrow increments or “bins” of height (further discussed in Chapter 4), with the height scale increasing from left to right. One sees five well-resolved histogram peaks, spaced by 4 Å between adjacent peaks, the signature step size between adjacent (100) planes of SrTiO3. The area under each peak—the total count of pixels—quantifies the relative surface area of each terrace within the imaged region. The shapes of step contours and extent of terraces are interesting for many reasons; for example, these may provide information on the kinetics and thermodynamics by which steps and terraces form during material growth processes [5].
Figure 1.3 (a) 800 × 800-nm height image of SrTiO3(100). (b) Histogram of preceding image.
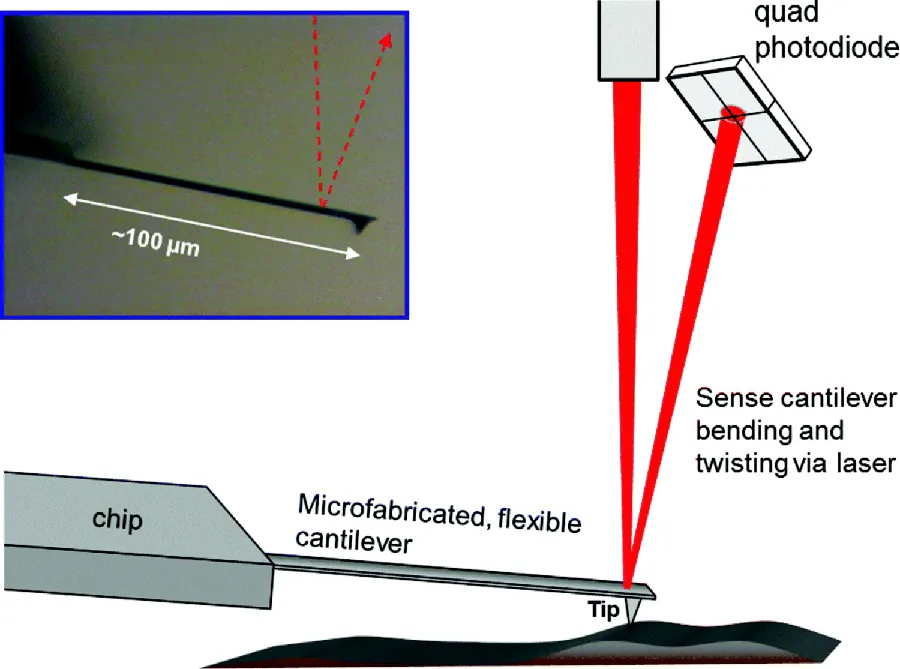
How exactly does AFM determine the local height of a surface? By touching it with a sharp object, while measuring the vertical or “Z” displacement needed to do so. This “touching,” however, can be very subtle; that is, the metaphor can be taken too literally. Moreover, heights are indirectly measured, as detailed in Chapter 4. In most AFM designs,3 and as depicted in Figure 1.4, the sharp tip (also known as stylus, probe, or needle) is attached to a flexible microcantilever—essentially a microscopic diving board—which bends under the influence of force. The behavior is that of a tip attached to a spring; a cantilever bent upward or downward is that of a compressed or extended spring. The bending is usually measured by reflecting a laser beam off of the cantilever and onto a split photodiode (a horizontal “knife edge”), the output of which gauges the position of the laser spot. The vertical tip movement, in turn, is quantified from this cantilever bending. Lateral forces that torque the tip, causing the cantilever to twist, can be measured via the horizontal movement of the laser spot (at a vertical “knife edge”). (We discuss lateral force methods in detail in Chapter 7.) The measurement typically will handle a vertical tip range of hundreds of nanometers, and with subnanometer resolution as detailed in Chapter 3 (including caveats). The vertical spring constants of cantilevers in common use range from 10−2 N/m to 102 N/m (or nN/nm), resulting in a measurable force range from pico-Newtons to micro-Newtons.
Figure 1.4 Schematic illustration of the core components of AFM: tip/cantilever/chip, focused laser beam, quad photodiode. Inset is light micrograph of a real AFM cantilever/tip viewed from the side; cantilever is 100 μm long, tip 10 μm tall.
In the simplest picture, one would bring the tip into contact with a surface, start moving or scanning laterally, and measure the vertical tip movement as the cantilever bends up and down to gauge surface height while the tip slides over the surface. (Imagine the surface moving back and forth in Figure 1.4.) By doing so, over a 2D grid of locations across the surface, one could build up a surface topograph: height versus X and Y. But this scheme generally does not work very well because the up and down bending of the cantilever corresponds to higher and lower spring forces pressing the tip against the surface such that the tip or sample might be damaged due to high contact force atop the hills, and, conversely, the tip and sample might separate or disengage in the deepest valleys. Moreover, there is always some arbitrary tilt between a sample surface and the X–Y plane of the scanning device such that forces would continually grow while scanning in one direction (cantilever bending further up) and the surface would “recede from view” if scanning far in the opposite direction as contact is lost. The range of the split photodiode measurement may not be sufficient to gauge large excursions of the tip up or down anyway (i.e., large laser spot excursions). So AFMs normally employ scanning devices that displace not only X and Y but also Z, via feedback, to offset variations in height and keep the pressing force approximately constant.4 This reactive Z displacement is, then, the sought measurement of surface height.5 We will discuss in greater detail each of these components—tip/cantilever, laser, photodetector, scanner, and feedback circuit—as well as nonidealities and caveats associated with these components, plus the physics of the tip–sample interaction that affect topographic imaging—in Chapters 2–5.
1.2 Property Sensitive Imaging: Vertical Touching and Sliding Friction
AFM is, however, much more powerful as an analytical tool! One is touching the surface of an object that one wishes to understand. Using touch to measure height, but nothing else, seems unambitious. We all know that a piece of upholstery feels different from a piece of concrete. Food has a different texture if moist instead of dry. We wish to detect, even quantify, such differences with AFM. After all, a major goal of microscopy is to differentiate objects or regions. This may include materials such as metals, semiconductors, ceramics, minerals, polymers, or other organics—or biological entities such as cells, tissues, and biomolecules (e.g., proteins, polysaccharides, nucleic acids, lipids)—or, for that matter, may differentiate synthetic from biological. Also, one wishes to detect changes in a given material—say from amorphous, meaning atomically disordered, to crystalline—or from biologically functional to denatured. If we can touch at the nanoscale, and in a highly controlled way..., cannot we distinguish materials or biological entities based on unique properties, that is, how they “feel?” Understanding surface topography measurements by AFM is a first goal, but much of this book's subject matter relates to this second question: how to differentiate sample constituents and measure the properties of a given constituent. This encompasses changes in properties under variable environments including gaseous, liquid, and variable temperature, upon chemical treatment or with aging, and as a function of measurement parameters such as rate or applied force [6–8].
A common property metric is the rigidity or stiffness of a material, sensed as the resistance to the tip pushing in—the increase of repulsive force per unit distance of deformation.6 7 Rubbery polymers, for example, derive their soft character from molecular composition, with f...