
eBook - ePub
Valuation Techniques
Discounted Cash Flow, Earnings Quality, Measures of Value Added, and Real Options
David T. Larrabee, Jason A. Voss
This is a test
Buch teilen
- English
- ePUB (handyfreundlich)
- Über iOS und Android verfügbar
eBook - ePub
Valuation Techniques
Discounted Cash Flow, Earnings Quality, Measures of Value Added, and Real Options
David T. Larrabee, Jason A. Voss
Angaben zum Buch
Buchvorschau
Inhaltsverzeichnis
Quellenangaben
Über dieses Buch
Analysis and insights from top thought leaders on a pivotal topic in investing and asset management
Valuation is the cornerstone for investment analysis, and a thorough understanding and correct application of valuation methodologies are critical for long-term investing success. Edited by two leading valuation experts from CFA Institute, this book brings together the insights and expertise of some of the most astute and successful investment minds of the past 50 years. From Benjamin Graham, the "father of value investing, " to Aswath Damodaran, you'll learn what these investment luminaries have to say about investment valuation techniques, including earnings and cash flow analysis.
- Features the best thinking on valuation from the industry's masters on the topic, supplemented with dozens of fascinating and instructive real-world examples
- Comprehensively discusses special valuation situations, such as real options, employee stock options, highly leveraged firms, corporate takeovers, and more
- Supplies you with the tools you need to successfully navigate and thrive in the ever-changing financial markets
- Is being produced with the full support and input of CFA Institute, the world's leading association of investment professionals
Häufig gestellte Fragen
Wie kann ich mein Abo kündigen?
Gehe einfach zum Kontobereich in den Einstellungen und klicke auf „Abo kündigen“ – ganz einfach. Nachdem du gekündigt hast, bleibt deine Mitgliedschaft für den verbleibenden Abozeitraum, den du bereits bezahlt hast, aktiv. Mehr Informationen hier.
(Wie) Kann ich Bücher herunterladen?
Derzeit stehen all unsere auf Mobilgeräte reagierenden ePub-Bücher zum Download über die App zur Verfügung. Die meisten unserer PDFs stehen ebenfalls zum Download bereit; wir arbeiten daran, auch die übrigen PDFs zum Download anzubieten, bei denen dies aktuell noch nicht möglich ist. Weitere Informationen hier.
Welcher Unterschied besteht bei den Preisen zwischen den Aboplänen?
Mit beiden Aboplänen erhältst du vollen Zugang zur Bibliothek und allen Funktionen von Perlego. Die einzigen Unterschiede bestehen im Preis und dem Abozeitraum: Mit dem Jahresabo sparst du auf 12 Monate gerechnet im Vergleich zum Monatsabo rund 30 %.
Was ist Perlego?
Wir sind ein Online-Abodienst für Lehrbücher, bei dem du für weniger als den Preis eines einzelnen Buches pro Monat Zugang zu einer ganzen Online-Bibliothek erhältst. Mit über 1 Million Büchern zu über 1.000 verschiedenen Themen haben wir bestimmt alles, was du brauchst! Weitere Informationen hier.
Unterstützt Perlego Text-zu-Sprache?
Achte auf das Symbol zum Vorlesen in deinem nächsten Buch, um zu sehen, ob du es dir auch anhören kannst. Bei diesem Tool wird dir Text laut vorgelesen, wobei der Text beim Vorlesen auch grafisch hervorgehoben wird. Du kannst das Vorlesen jederzeit anhalten, beschleunigen und verlangsamen. Weitere Informationen hier.
Ist Valuation Techniques als Online-PDF/ePub verfügbar?
Ja, du hast Zugang zu Valuation Techniques von David T. Larrabee, Jason A. Voss im PDF- und/oder ePub-Format sowie zu anderen beliebten Büchern aus Business & Valuation. Aus unserem Katalog stehen dir über 1 Million Bücher zur Verfügung.
PART I
VALUATION PERSPECTIVES: THEN AND NOW
Chapter 1 Two Illustrative Approaches to Formula Valuations of Common Stocks
Chapter 2 Seeking a Margin of Safety and Valuation
CHAPTER 1
TWO ILLUSTRATIVE APPROACHES TO FORMULA VALUATIONS OF COMMON STOCKSa
Two common-stock valuation approaches are examined in detail. The first approach considers company profitability, earnings growth and stability, and dividend payout. It derives an independent value of a stock that is then compared with the market price. In contrast, the second approach starts with the market price of a stock and calculates the rate of future growth implied by the market. From the expected growth rate, future earnings can be derived, as well as the implicit earnings multiplier in the current market price. Both approaches demonstrate that the market often has future growth expectations that cannot be derived from companies’ past performance.
Of the various basic approaches to common-stock valuation, the most widely accepted is that which estimates the average earnings and dividends for a period of years in the future and capitalizes these elements at an appropriate rate. This statement is reasonably definite in form, but its application permits of the widest range of techniques and assumptions, including plain guesswork. The analyst has first a broad choice as to the future period he will consider; then the earnings and dividends for the period must be estimated, and finally a capitalization rate selected in accordance with his judgment or his prejudices. We may observe here that since there is no a priori rule governing the number of years to which the valuer should look forward in the future, it is almost inevitable that in bull markets investors and analysts will tend to see far and hopefully ahead, whereas at other times they will not be so disposed to “heed the rumble of a distant drum.” Hence arises a high degree of built-in instability in the market valuation of growth stocks, so much so that one might assert with some justice that the more dynamic the company the more inherently speculative and fluctuating may be the market history of its shares.1
When it comes to estimating future earnings few analysts are willing to venture forth, Columbus-like, on completely uncharted seas. They prefer to start with known quantities—e.g., current or past earnings—and process these in some fashion to reach an estimate for the future. As a consequence, in security analysis the past is always being thrown out of the window of theory and coming in again through the back door of practice. It would be a sorry joke on our profession if all the elaborate data on past operations, so industriously collected and so minutely analyzed, should prove in the end to be quite unrelated to the real determinants of the value—the earnings and dividends of the future.
Undoubtedly there are situations, not few perhaps, where this proves to be the rueful fact. But in most cases the relationship between past and future proves significant enough to justify the analyst’s preoccupation with the statistical record. In fact the daily work of our practitioner consists largely of an effort to construct a plausible picture of a company’s future from his study of its past performance, the latter phrase inevitably suggesting similar intensive studies carried on by devotees of a very different discipline. The better the analyst he is, the less he confines himself to the published figures and the more he adds to these from his special study of the company’s management, its policies, and its possibilities.
The student of security analysis, in the classroom or at home, tends to have a special preoccupation with the past record as distinct from an independent judgment of the company’s future. He can be taught and can learn to analyze the former, but he lacks a suitable equipment to attempt the latter. What he seeks, typically, is some persuasive method by which a company’s earnings record—including such aspects as the average, the trend or growth, stability, etc.—plus some examination of the current balance sheet, can be transmuted first into a projection of future earnings and dividends, and secondly into a valuation based on such projection.
A closer look at this desired process will reveal immediately that the future earnings and dividends need not be computed separately to produce the final value. Take the simplest presentation:
1. Past earnings times X equal future earnings.
2. Future earnings times Y equal Present Value.
This operation immediately foreshortens to:
3. Past Earnings times XY equal Present Value.
It is the XY factor, or multiplier of past earnings, that my students would dearly love to learn about and to calculate. When I tell them that there is no dependable method of finding this multiplier they tend to be incredulous or to ask, “What good is security analysis then?” They feel that if the right weight is given to all the relevant factors in the past record, at least a reasonably good present valuation of a common stock can be produced, one that will take probable future earnings into account and can be used as a guide to determine the attractiveness or the reverse of the issue at its current market price.
In this article I propose to explain two approaches of this kind which have been developed in a Seminar on Common-Stock Valuation. I believe the first will illustrate reasonably well how formula operations of this kind may be worked out and applied. Ours is an endeavor to establish a comparative value in 1957 for each of the 30 stocks in the Dow-Jones Industrial Average, related to a base valuation of 400 and 500, respectively, for the composite or group. (The 400 figure represented the approximate “Central Value” of the Dow-Jones Average, as found separately by a whole series of formula methods derived from historical relationships. The 500 figure represented about the average market level for the preceding twelve months.)
As will be seen, the valuations of each component issue take into account the four “quality elements” of profitability, growth, stability and dividend pay-out, applying them as multipliers to the average earnings for 1947–1956. In addition, and entirely separately, a weight of 20% is given to the net asset value.
The second approach is essentially the reverse of that just described. Whereas the first method attempts to derive an independent value to be compared with the market price, the second starts with the market price and calculates therefrom the rate of future growth expected by the market. From that figure we readily derive the earnings expected for the future period, in our case 1957–1966, and hence the multiplier for such future earnings implicit in the current market price.
The place for detailed comment on these calculations is after they have been developed and presented. But it may be well to express the gist of my conclusions at this point, viz.:
1. Our own “formula valuations” for the individual stocks, and probably any others of the same general type, have little if any utility in themselves. It would be silly to assert that Stock A is “worth” only half its market price, or Stock B twice its market price, because these figures result from our valuation formula.
2. On the other hand, they may be suggestive and useful as composite reflections of the past record, taken by itself. They may even be said to represent what the value would be, assuming that the future were merely a continuation of past performances.
3. The analyst is thus presented with a “discrepancy” of definite magnitude, between formula “value” and the price, which it becomes his task to deal with in terms of his superior knowledge and judgment. The actual size of these discrepancies, and the attitude that may possibly be taken respecting them, are discussed below.
Similarly, the approach which starts from the market price, and derives an implied “growth factor” and an implied multiplier therefrom, may have utility in concentrating the analyst’s attention on just what the market seems to be expecting from each stock in the future, in comparison or contrast with what it actually accomplished in the past. Here again his knowledge and judgment are called upon either to accept or reject the apparent assumptions of the marketplace.
Method 1. A Formula Valuation Based Solely on Past Performance in Relation to the Dow-Jones Industrial Average as a Group.
The assumptions underlying this method are the following:
1. Each component issue of the Dow-Jones Industrial Average may be valued in relation to a base value of the average as a whole by a comparison of the statistical records.
2. The data to be considered are the following:
a. Profitability—as measured by the rate of return on invested capital. (For convenience this was computed only for the year 1956.)
b. Growth of per-share earnings—as shown by two measurements: 1947–56 earnings vs. 1947 earnings, and 1956 earnings vs. 1947–56 earnings.
(It would have been more logical to have used the 1954–56 average instead of the single year 1956, but the change would have little effect on the final valuations.)
c. Stability—as measured by the greatest shrinkage of profits in the periods 1937–1938 and 1947–1956.
(The calculation is based on the percentage of earnings retained in the period of maximum shrinkage.)
d. Pay-out—as measured by the ratio of 1956 dividends to 1956 earnings. In the few cases where the 1956 earnings were below the 1947–56 average we substituted the latter for the former, to get a more realistic figure of current pay-out.
These criteria demonstrate the quality of the company’s earnings (and dividend policy) and thus may control the multiplier to be applied to the earnings. The figure found under each heading is divided by the corresponding figure for the Dow-Jones group as a whole, to give the company’s relative performance. The four relatives were then combined on the basis of equal weights to give a final “quality index” of the company as against the overall quality of the group.
The rate of earnings on invested capital is perhaps the most logical measure of the success and quality of an enterprise. It tells how productive are the dollars invested in the business. In studies made in the relatively “normal” market of 1953 I found a surprisingly good correlation between the profitability rate and the price-earnings ratio, after introducing a major adjustment for the dividend payout and a minor (moderating) adjustment for net asset value.
It is not necessary to emphasize the importance of the growth factor to stock-market people. They are likely to ask rather why we have not taken it as the major determinant of quality and multipliers. There is little doubt that the expected future growth is in fact the major influence upon current price-earnings ratios, and this truth is fully recognized in our second approach, which deals with growth expectations as reflected in market prices. But the correlation between market multipliers and past growth is by no means close.
Some interesting figures worked out by Ralph A. Bing show this clearly.2 Dow Chemical, with per-share earnings growth of 31% (1955 vs. 1948) had in August 1956 a price-earnings ratio of 47.3 times 1955 earnings. Bethlehem Steel, with corresponding growth of 93%, had a multiplier of only 9.1. The spread between the two relationships is thus as wide as fourteen to one. Other ratios in Mr. Bing’s table show similar wide disparities between past growth and current multipliers.
It is here that the stability factor asserts its importance. The companies with high multipliers may not have had the best growth in 1948–55, but most of them had greater than average stability of earnings over the past two decades.
These considerations led us to adopt the simple arithmetical course of assigning equal weight to past growth, past stability, and current profitability in working out the quality coefficient for each company. The dividend payout is not strictly a measure of quality of earning power, though in the typical case investors probably regard it in some such fashion. Its importance in most instances is undeniable, and it is both convenient and plausible to give it equal weight and similar treatment with each of the other factors just discussed.
Finally we depart from the usual Wall Street attitude and assign a weight of 20% in the final valuation to the net assets per share. It is true that in the typical case the asset value has no perceptible influence on current market price. But it may have some long-run effect on future market price, and thus it has a claim to be considered seriously in any independent valuation of a company. As is well known, asset values invariably play some part, sometimes a fairly important one, in the many varieties of legal valuations of common stocks, which grow out of tax cases, merger litigation, and the like. The basic justification for considering asset value in this process, even though it may be ignored in the current market price, lies in the possibility of its showing its weight later, through competitive developments, changes in management or its policies, merger or sale eventuality, etc.
The above discussion will explain, perhaps not very satisfactorily, why the four factors entering into the quality rating and the fifth factor of asset value were finally assigned equal weight of 20% each.
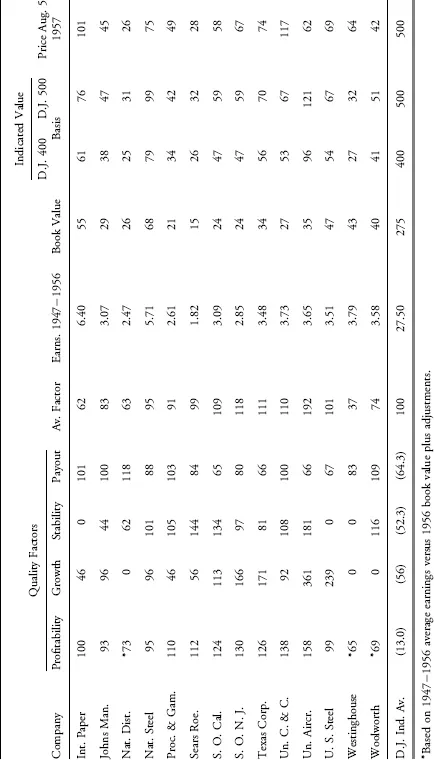
The actual application of our illustrative method can now be explained by working through the figures for the first company in the group, Allied Chemical & Dye. Following are data used in computing the “value” of ACD relative to a 400 and a 500 valuation for the Dow-Jones Industrial Average:
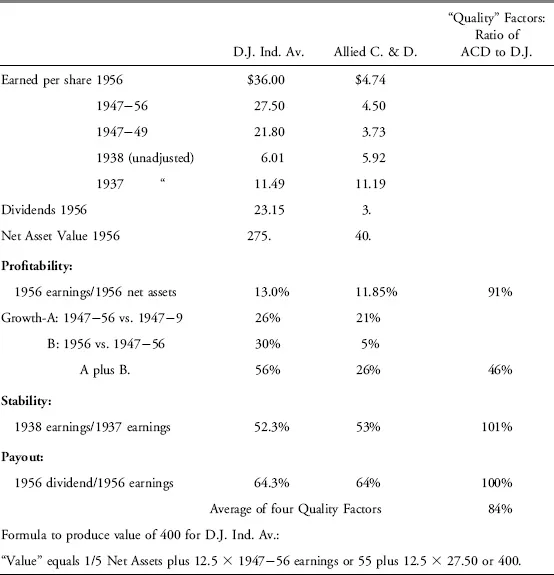
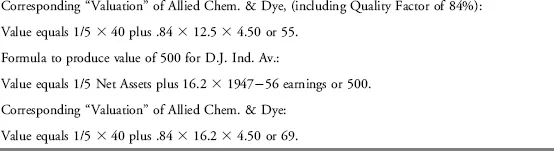
In Table 1.1 we supply the “valuation” reached by this method for each of the 30 stocks in the Dow Jones Industrial Average. Our table includes the various quality factors, the average earnings, and the asset values used to arrive at our final figures.
TABLE 1.1 Formula Valuations of Dow-Jones Industrial Issues
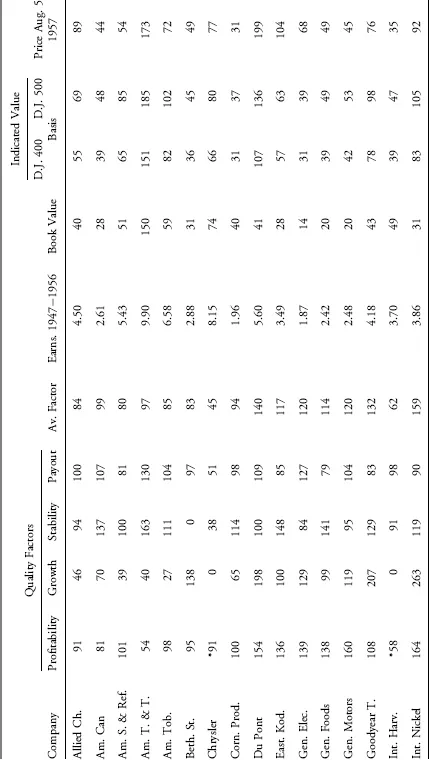
In about half the cases these “valuations” differ quite widely from the prices ruling on August 5 last, on which date the D. J. Average actually sold at 500. Seven issues were selling at 20% or more above their formula value, and an equal number at 20% or more below such value. At the extremes we find Westinghouse selling at a 100% “premium,” and United Aircraft at about a 50% “discount.” The extent of these disparities naturally suggests that our method is technically a poor one, and that more plausible valuations could be reached—i.e., ones more congruous with market prices—if a better choice were made of the factors and weights entering into...