
eBook - ePub
Statistics Toolkit
Rafael Perera, Carl Heneghan, Douglas Badenoch
This is a test
Buch teilen
- English
- ePUB (handyfreundlich)
- Über iOS und Android verfügbar
eBook - ePub
Statistics Toolkit
Rafael Perera, Carl Heneghan, Douglas Badenoch
Angaben zum Buch
Buchvorschau
Inhaltsverzeichnis
Quellenangaben
Über dieses Buch
This concise book will help you to interpret the statistical evidence provided by quantitative studies and to plan how to work with data in your own clinical research. Following the successful format of the Toolkit series, Statistics Toolkit guides the reader through statistical concepts using flowcharts, diagrams and real life examples to reflect concepts in a simple and practical manner.
Sections include:
- Clear explanation of basic concepts in the context of clinical research
- Demonstration of how data are described, displayed and interpreted in different formats
- Practical glossary and key to the symbols used in statistics and a discussion of the software tools
The book offers a handy, quick reference that has an easy-to-follow structure throughout, making it ideal for health care professionals and students.
Häufig gestellte Fragen
Wie kann ich mein Abo kündigen?
Gehe einfach zum Kontobereich in den Einstellungen und klicke auf „Abo kündigen“ – ganz einfach. Nachdem du gekündigt hast, bleibt deine Mitgliedschaft für den verbleibenden Abozeitraum, den du bereits bezahlt hast, aktiv. Mehr Informationen hier.
(Wie) Kann ich Bücher herunterladen?
Derzeit stehen all unsere auf Mobilgeräte reagierenden ePub-Bücher zum Download über die App zur Verfügung. Die meisten unserer PDFs stehen ebenfalls zum Download bereit; wir arbeiten daran, auch die übrigen PDFs zum Download anzubieten, bei denen dies aktuell noch nicht möglich ist. Weitere Informationen hier.
Welcher Unterschied besteht bei den Preisen zwischen den Aboplänen?
Mit beiden Aboplänen erhältst du vollen Zugang zur Bibliothek und allen Funktionen von Perlego. Die einzigen Unterschiede bestehen im Preis und dem Abozeitraum: Mit dem Jahresabo sparst du auf 12 Monate gerechnet im Vergleich zum Monatsabo rund 30 %.
Was ist Perlego?
Wir sind ein Online-Abodienst für Lehrbücher, bei dem du für weniger als den Preis eines einzelnen Buches pro Monat Zugang zu einer ganzen Online-Bibliothek erhältst. Mit über 1 Million Büchern zu über 1.000 verschiedenen Themen haben wir bestimmt alles, was du brauchst! Weitere Informationen hier.
Unterstützt Perlego Text-zu-Sprache?
Achte auf das Symbol zum Vorlesen in deinem nächsten Buch, um zu sehen, ob du es dir auch anhören kannst. Bei diesem Tool wird dir Text laut vorgelesen, wobei der Text beim Vorlesen auch grafisch hervorgehoben wird. Du kannst das Vorlesen jederzeit anhalten, beschleunigen und verlangsamen. Weitere Informationen hier.
Ist Statistics Toolkit als Online-PDF/ePub verfügbar?
Ja, du hast Zugang zu Statistics Toolkit von Rafael Perera, Carl Heneghan, Douglas Badenoch im PDF- und/oder ePub-Format sowie zu anderen beliebten Büchern aus Medicine & Biostatistics. Aus unserem Katalog stehen dir über 1 Million Bücher zur Verfügung.
Information
Systematic reviews 1: odds, odds ratio, heterogeneity, funnel plots

Question: In patients on anticoagulation with warfarin, does self-monitoring or self-management lead to improved outcomes?
Heneghan et al. Lancet 2006;367:404-11.
The purpose of systematic reviews is to combine all of the unbiased studies that have been done on a particular question. If the review can pool the individual data from each of these studies (a meta-analysis), it can greatly increase the statistical power of the research by treating them as if they were in one large sample instead of many small ones.
When we read systematic reviews, we are principally concerned with:
- whether the review found and included all the good-quality studies;
- how to extract and pool the data from different studies; and
- whether it makes sense to combine them.
The reviewers found 14 RCTs and extracted data on thromboembolic events, major bleeding, death and the proportion of measurements that were within the target range.
The review reports the setting, follow-up, sample size and intervention details for each study included.
Tests used: The odds ratio (OR) was used to calculate a combined measure from all of the studies: three different methods were employed.
The data were tested for heterogeneity using the χ2 and I2 statistics. Two tests were used to detect for publication bias: Begg’s rank correlation and Egger’s linear regression.

Using odds to represent risk:
The risks of clinical events were presented as the odds of the event in each group. The odds is the ratio of the number of patients that have the event to the number of patients that do not have it. If 10 people have a heart attack out of 100 in the intervention group the odds are 10/90 = 1:9. Note the difference between the odds and frequencies: frequencies in the same group = 10/100 = 10%.
What are odds?
Odds are a way of stating the probability of an event. When we look at a group of patients, the odds of the event in that group are the number of patients who have an event divided by the number who do not.
| Control group | Experimental group | |
| Event | A | B |
| No event | C | D |
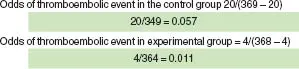
The odds of an event in the control group is A/C; likewise, the odds of an event in the experimental group is B/D.
Menendez Jandula 05, from Heneghan et al. Lancet 2006;367:404-11.
This might seem like a convoluted way of doing things, but odds have particular statistical properties that lend themselves to meta-analysis.
Odds ratios
When we want to compare the difference between a control and experimental group, we can use the odds ratio (OR). The OR is the ratio of the odds in one group divided by the odds in a different group: the experimental group’s odds divided by the treatment group’ odds.
Menendez Jandula 05, from Heneghan et al. Lancet 2006; 367: 404-11.

If the odds ratio is greater than one, it indicates more events in the experimental group; if it is less than one, it indicates fewer events in the experimental group. If the odds ratio is exactly one, there is no difference between the groups. If the confidence interval around the odds ratio overlaps the value of one, we can say that it is not statistically significant.
Combining odds ratios
In this review, the authors used a fixed effects model to combine the odds ratios into one overall estimate. Where heterogeneity existed in the data, they used a random effects model.
In a systematic review, we don’t just want to compare the odds between one control group and one experimental group; we want to combine lots of data from different control and experimental groups.
Unfortunately, we can’t just add up all the participants on each side (this would break the randomisation potentially giving the wrong results): to retain the validity of the original research, we have to work with the odds ratios from each study and not the total numbers of patients.
The easiest way to do this would be to take the mean of all the odds ratios. However, this would give the same weight to all studies regardless of the number of participants (meaning that each patient would count double in a study containing 100 participants compared with one containing 200). We need to take into account that some studies provide more information than others (e.g. higher event rates).
Therefore, when we combine odds ratios we have to adjust for the study size and event rate. The standard error (SE) is a statistical measure that takes both of these factors into account. It is commonly assumed that the smaller the SE in a study’s results, the more importance the study should be given.
The inverse of the square of the standard error (SE) gives a measure of precision; the larger the precision around any measure, the more certain we are of the measure itself.
There are two approaches to combining the studies, based on the types of assumption made about the nature of the data:
Use the Mantel-Haenszel approach when it is safe to assume that the data are from similar studies and have moderate sample sizes.
Use the Peto method when there are very low event rates.
1. Fixed effects model: The fixed effects model is based on the assumption that all the different data sets come from the same population and are measuring the same thing. In other words, the ‘true’ treatment effect in each study is in fact identical.
In this review, the Mantel-Haenszel approach was used. This approach assumed a fixed effect model, which gives greater weight to odds ratios from studies with a lower standard error.
Unfortunat...