
eBook - ePub
Medical Statistics from Scratch
An Introduction for Health Professionals
David Bowers
This is a test
Buch teilen
- English
- ePUB (handyfreundlich)
- Über iOS und Android verfügbar
eBook - ePub
Medical Statistics from Scratch
An Introduction for Health Professionals
David Bowers
Angaben zum Buch
Buchvorschau
Inhaltsverzeichnis
Quellenangaben
Über dieses Buch
Correctly understanding and using medical statistics is a key skill for all medical students and health professionals. In an informal and friendly style, Medical Statistics from Scratch provides a practical foundation for everyone whose first interest is probably not medical statistics. Keeping the level of mathematics to a minimum, it clearly illustrates statistical concepts and practice with numerous real-world examples and cases drawn from current medical literature.
Medical Statistics from Scratch is an ideal learning partner for all medical students and health professionals needing an accessible introduction, or a friendly refresher, to the fundamentals of medical statistics.
Häufig gestellte Fragen
Wie kann ich mein Abo kündigen?
Gehe einfach zum Kontobereich in den Einstellungen und klicke auf „Abo kündigen“ – ganz einfach. Nachdem du gekündigt hast, bleibt deine Mitgliedschaft für den verbleibenden Abozeitraum, den du bereits bezahlt hast, aktiv. Mehr Informationen hier.
(Wie) Kann ich Bücher herunterladen?
Derzeit stehen all unsere auf Mobilgeräte reagierenden ePub-Bücher zum Download über die App zur Verfügung. Die meisten unserer PDFs stehen ebenfalls zum Download bereit; wir arbeiten daran, auch die übrigen PDFs zum Download anzubieten, bei denen dies aktuell noch nicht möglich ist. Weitere Informationen hier.
Welcher Unterschied besteht bei den Preisen zwischen den Aboplänen?
Mit beiden Aboplänen erhältst du vollen Zugang zur Bibliothek und allen Funktionen von Perlego. Die einzigen Unterschiede bestehen im Preis und dem Abozeitraum: Mit dem Jahresabo sparst du auf 12 Monate gerechnet im Vergleich zum Monatsabo rund 30 %.
Was ist Perlego?
Wir sind ein Online-Abodienst für Lehrbücher, bei dem du für weniger als den Preis eines einzelnen Buches pro Monat Zugang zu einer ganzen Online-Bibliothek erhältst. Mit über 1 Million Büchern zu über 1.000 verschiedenen Themen haben wir bestimmt alles, was du brauchst! Weitere Informationen hier.
Unterstützt Perlego Text-zu-Sprache?
Achte auf das Symbol zum Vorlesen in deinem nächsten Buch, um zu sehen, ob du es dir auch anhören kannst. Bei diesem Tool wird dir Text laut vorgelesen, wobei der Text beim Vorlesen auch grafisch hervorgehoben wird. Du kannst das Vorlesen jederzeit anhalten, beschleunigen und verlangsamen. Weitere Informationen hier.
Ist Medical Statistics from Scratch als Online-PDF/ePub verfügbar?
Ja, du hast Zugang zu Medical Statistics from Scratch von David Bowers im PDF- und/oder ePub-Format sowie zu anderen beliebten Büchern aus Medicine & Biostatistics. Aus unserem Katalog stehen dir über 1 Million Bücher zur Verfügung.
Information
II
Descriptive Statistics
2
Describing data with tables
Learning objectives
When you have read this chapter, you should be able to:
- Explain what a frequency distribution is.
- Construct a frequency table from raw data.
- Construct relative frequency, cumulative frequency, and relative cumulative frequency tables.
- Construct grouped frequency tables.
- Construct a cross‐tabulation table.
- Explain what a contingency table is.
- Rank data.
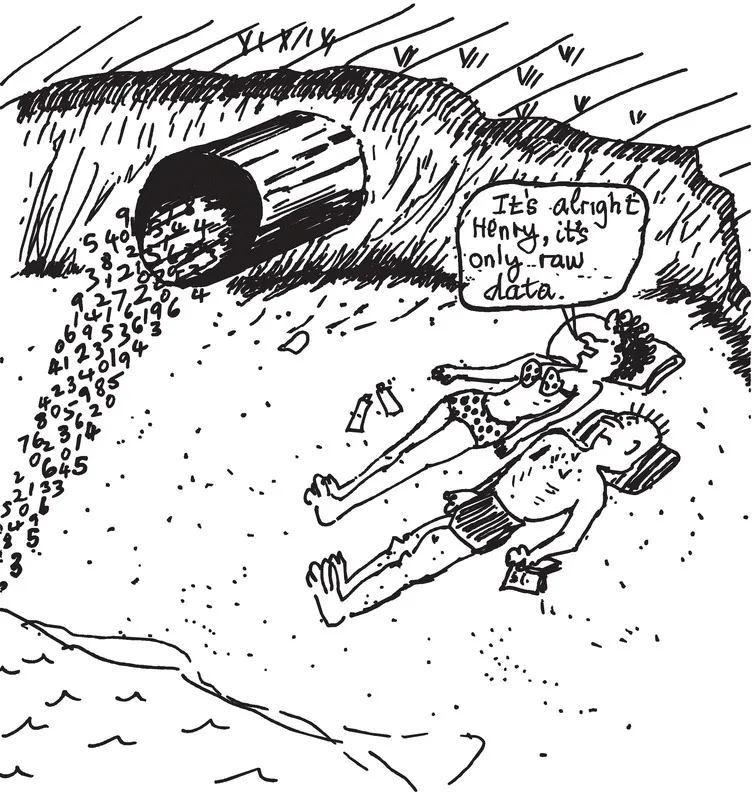
Descriptive statistics. What can we do with raw data?
As we saw in Chapter 1, when we have a lot of raw data, for example, as in Figure 1.1 (birthweight) or Figure 1.2 (gender), it is not easy for us to answer questions that we may have; for example, the percentage of low birthweight babies or the proportion of male babies. This is because the data have not been arranged or structured in any way. If there are any interesting features in the data, they remain hidden from us. We said then that the data could not tell their story, and of course, the more data there are, the harder this becomes. Samples of many hundreds or thousands are not uncommon.
In this chapter, and the four following, we are going to describe some methods for organising and presenting the data, so that we can answer more easily the questions of interest – essentially to enable us to see what’s going on. Collectively, these methods are called descriptive statistics. They are a set of procedures that we can apply to raw data, so that its principal characteristics and main features are revealed. This might include sorting the data by size, putting it into a table, presenting it as a chart, or summarising it numerically.
An important consideration in this process is the type of data you are working with. Some types of data are best described with a table, some with a chart and some perhaps with both, whereas with other types of data, a numeric summary might be more appropriate. In this chapter, we focus on organising raw data into what is known as a frequency table. In subsequent chapters, we will look at the use of charts, and numeric summaries. It will be easier if we take each data type in turn, starting with nominal data.
Frequency tables – nominal data
We have already seen a rudimentary frequency table in Chapter 1, with a count of male and female babies from Figure 1.2.
| Male | 56 |
| Female | 44 |
We can express this information in the more conventional form of a frequency table, as in Figure 2.1.
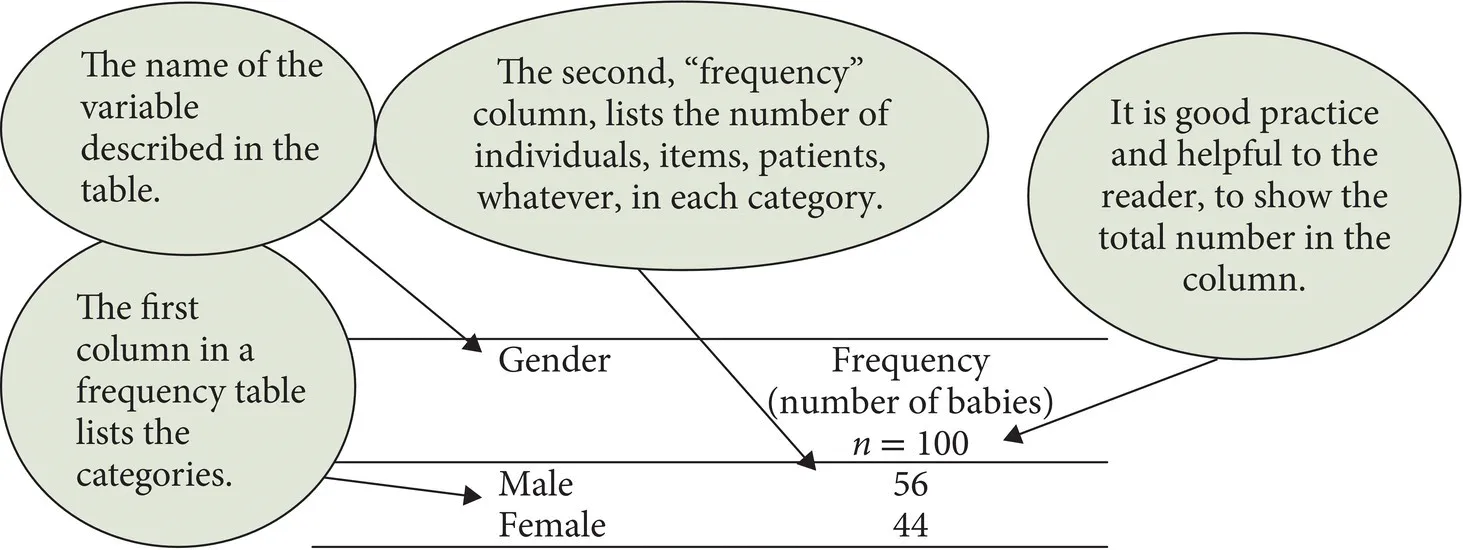
Figure 2.1 A frequency table for gender of newborn babies (raw data from Figure 1.2).
The label at the top of the first (left‐hand) column indicates the variable being described in the table. The remainder of the first column is a list of the categories for this variable. The second (right‐hand) column is the frequency column. Frequency is another word for “count,” and lists in this example, the number of babies in each category, that is, Males and Females.
Exercise 2.1. Using the raw data from Figure 1.3, construct a frequency table for the number of women who smoked while pregnant. Does it matter how you order the categories in the first column?
The frequency distribution
Consider another example. Figure 1.9 contains data from a nit lotion study that compared two types of treatment for nits, malathion or d‐phenothrin, with a sample of 95 children. For each child, data were collected on nine variables, one being the child’s hair colour: blonde, brown, red, and dark. The frequency table (extracted from Figure 1.9) for the four colour categories...