
eBook - ePub
Urban Analytics
Alex D. Singleton,Seth Spielman,David Folch
This is a test
Buch teilen
- 200 Seiten
- English
- ePUB (handyfreundlich)
- Über iOS und Android verfügbar
eBook - ePub
Urban Analytics
Alex D. Singleton,Seth Spielman,David Folch
Angaben zum Buch
Buchvorschau
Inhaltsverzeichnis
Quellenangaben
Über dieses Buch
The economic and political situation of cities has shifted in recent years in light ofrapid growth amidst infrastructure decline, the suburbanization of poverty and inner city revitalization.At the same time, the way that data are used to understand urban systems has changed dramatically. Urban Analytics offers a field-defining look at thechallenges and opportunities of using new and emerging data to study contemporary and future cities through methods including GIS, Remote Sensing, Big Data and Geodemographics. Written in an accessible style and packed with illustrations and interviews from key urban analysts, this is a groundbreaking new textbook for students of urban planning, urban design, geography, and the information sciences.
Häufig gestellte Fragen
Wie kann ich mein Abo kündigen?
Gehe einfach zum Kontobereich in den Einstellungen und klicke auf „Abo kündigen“ – ganz einfach. Nachdem du gekündigt hast, bleibt deine Mitgliedschaft für den verbleibenden Abozeitraum, den du bereits bezahlt hast, aktiv. Mehr Informationen hier.
(Wie) Kann ich Bücher herunterladen?
Derzeit stehen all unsere auf Mobilgeräte reagierenden ePub-Bücher zum Download über die App zur Verfügung. Die meisten unserer PDFs stehen ebenfalls zum Download bereit; wir arbeiten daran, auch die übrigen PDFs zum Download anzubieten, bei denen dies aktuell noch nicht möglich ist. Weitere Informationen hier.
Welcher Unterschied besteht bei den Preisen zwischen den Aboplänen?
Mit beiden Aboplänen erhältst du vollen Zugang zur Bibliothek und allen Funktionen von Perlego. Die einzigen Unterschiede bestehen im Preis und dem Abozeitraum: Mit dem Jahresabo sparst du auf 12 Monate gerechnet im Vergleich zum Monatsabo rund 30 %.
Was ist Perlego?
Wir sind ein Online-Abodienst für Lehrbücher, bei dem du für weniger als den Preis eines einzelnen Buches pro Monat Zugang zu einer ganzen Online-Bibliothek erhältst. Mit über 1 Million Büchern zu über 1.000 verschiedenen Themen haben wir bestimmt alles, was du brauchst! Weitere Informationen hier.
Unterstützt Perlego Text-zu-Sprache?
Achte auf das Symbol zum Vorlesen in deinem nächsten Buch, um zu sehen, ob du es dir auch anhören kannst. Bei diesem Tool wird dir Text laut vorgelesen, wobei der Text beim Vorlesen auch grafisch hervorgehoben wird. Du kannst das Vorlesen jederzeit anhalten, beschleunigen und verlangsamen. Weitere Informationen hier.
Ist Urban Analytics als Online-PDF/ePub verfügbar?
Ja, du hast Zugang zu Urban Analytics von Alex D. Singleton,Seth Spielman,David Folch im PDF- und/oder ePub-Format sowie zu anderen beliebten Büchern aus Social Sciences & Human Geography. Aus unserem Katalog stehen dir über 1 Million Bücher zur Verfügung.
Information
1: Questioning the City through Urban Analytics
Learning Objectives
By the end of this chapter students will understand the following:
- The majority of future population growth will be concentrated in urban areas.
- The planning and management of population change creates a range of challenges for cities.
- New forms of technology are increasingly embedded into city systems and are providing a wealth of new data.
- Urban analytics represents a methodological toolkit for studying and managing data-rich cities.
Human Settlements and Urbanization
Looking down onto the surface of the earth from space reveals a patchwork of urbanization. By 2015 the United Nations (UN) estimated that global population reached 7.3 billion people, and projected that this will have grown to 9.7 billion by 2050 (United Nations 2015). Not only has the world’s population grown, but the distribution of people has changed over time, and at some point in 2009 we reached a significant tipping point where more than half of the global population lived within urban as opposed to rural areas (United Nations 2009). This transition to urbanized living is driven by complex economic, technological, cultural, and geopolitical forces. Global urbanization has fundamentally changed how we (as a species) interact with one another and our natural environment, creating a range of challenges for the planning and management of urban areas.
By night, the scale and extent of urban areas can be rendered visible through satellite imagery that records the use of electric lighting (see Figure 1.1). However, the social, economic, and environmental impacts of these brightly lit places extend far beyond these borders. From space, those dark areas between city lights seem empty and undifferentiated. One can imagine these dark spaces to be a patchwork of agricultural and natural areas that are disconnected from the networks of lights. However, much of the globe, even these dark places, are linked together through a network of ecological and economic exchanges that fuel and support urbanization. Much of this network is material – a vast communications infrastructure that, while concentrated in cities, spans the entire globe.
What has fueled this growth? There is not one story – the forces that drive urbanization in the more developed parts of the world are different from the forces driving urbanization in the global South. Generically, residents of cities are attracted by the advantages of proximity to sources of employment, infrastructure, and cultural assets, or perhaps as a result of improved provision of healthcare or sanitation. The net result of this growth of cities is that a large share of the world’s population is connected to the economic and technological infrastructure that emanates from them.
The phenomenon of urbanization is not new, nor are those challenges emerging from these processes. However, a critical difference between urbanization of the twenty-first century and the waves of urbanization that have occurred in the past is that there are entirely new ways to understand these processes. The same information technologies that connect cities in a global network can also be used within them to manage the provision of services, and to mitigate the environmental impact of their metabolism within and beyond their borders. New ways of knowing and managing cities are occurring because of advances in those instruments that can monitor activities within or attributes of urban environments (see Chapter 2). Enhancements to communications infrastructure are enabling the data generated by such devices to be utilized by services in real time, and for devices to communicate with one another, potentially making automated decisions based upon derived information.
Figure 1.1 At night, urbanization is rendered visible on the earth’s surface through a satellite originally designed to detect cloud coverage
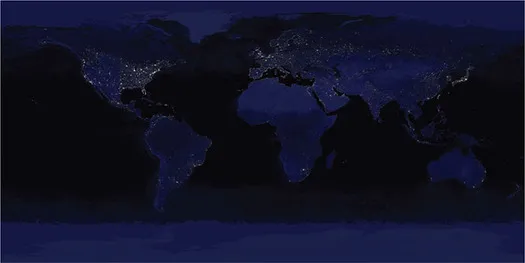
Source: Data courtesy Marc Imhoff of NASA GSFC and Christopher Elvidge of NOAA NGDC. Image by Craig Mayhew and Robert Simmon, NASA GSFC
The macro shape, structure, and function of urban areas emerge through an incredibly complex set of human interactions; cities are dynamic systems that evolve from the bottom up and over time (Batty 2013). Currently the most urbanized regions of the world include North America, Europe, Latin America, and the Caribbean (see Table 1.1); however, by 2050, it is estimated that 37 percent of new projected urban population growth will be attributable to just three countries in Africa and Asia, namely, China, India, and Nigeria (United Nations 2015).
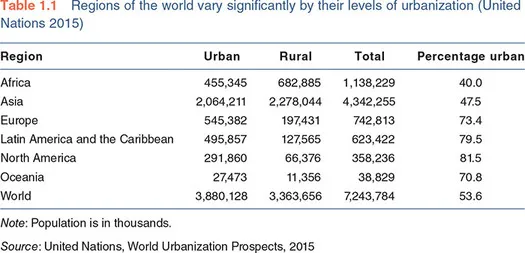
Note: Population is in thousands.
Source: United Nations, World Urbanization Prospects, 2015
However, the global narrative of increasing urbanization does not hold everywhere. While some cities expand rapidly, others are shrinking in response to macroeconomic trends, like the decline of manufacturing in many developed countries, environmental disasters (Box 1.1), and/or political instability. Urban areas require careful management, planning and investment if the negative societal impacts that can be associated with rapid or long-term change are to be avoided or mitigated. For cities with declining population, sustaining infrastructure (e.g., roads or schools) that was designed to service much larger populations can strain municipal finances and make it difficult to provide basic services like education and safety. Conversely, in a place with rapid population growth, how might public transit systems be reconfigured to meet this extra demand given land use constraints, such as increasing the density of people’s homes located at the site of a potential train stop, that might prevent the expansion of the transit network?
Governing cities is a complex and political process. While the new forms of data about cities do not ease the political burden, they can feed into decision-making processes and help to manage existing infrastructure more efficiently. Decisions about cities are complex, involving difficult trade-offs. However, there are a wealth of often disparate empirical data, a suite of methods or tools for translating this into information, and a mechanism for the communication of findings to stakeholders (Longley et al. 2015b). This book provides a background to this process.
Box 1.1: Change in Urban Areas – Hurricane Katrina and Information Technology
Hurricane Katrina struck the Gulf Coast of the United States in August 2005, and had devastating impacts on the population, infrastructure, and economy of the region. The city of New Orleans, Louisiana was acutely affected after a number of levees failed, leaving 80 percent of the city flooded under 15 to 20 feet (4.5 to 6 m) of water (Figure 1.2).
Figure 1.2 Searching for survivors in New Orleans

Source: US Coast Guard photo by Petty Officer 2nd Class NyxoLyno Cangemi (Wikipedia)
The total costs of Hurricane Katrina were catastrophic, with the National Oceanic and Atmospheric Administration (NOAA) estimating that there were 1,353 direct fatalities, 275,000 homes damaged or destroyed, along with financial costs in excess of $100 billion (Johnson 2006). With such significant impact to housing infrastructure and property, this resulted in a huge number of people being displaced into new locations. Figure 1.3 is not a direct proxy of these movements, but illustrates change at a state level after this event.
Figure 1.3 States where migrants housed within Louisiana during 2005 had moved to as of 2006
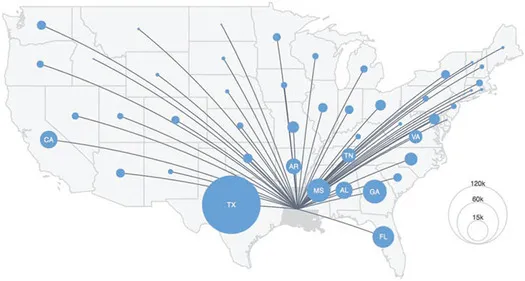
Source: Authors’ own; data – US Census Bureau, American Community Survey 2006; State to State Migration Flows 2004–2015
The impact of Hurricane Katrina on New Orleans illustrates the dynamic nature of urban areas, and indeed, over a decade on from the event, population levels have not recovered fully – although, even prior to the hurricane, the population had also been in decline from a peak in the 1970s (Figure 1.4).
In the aftermath of Hurricane Katrina, the then nascent technologies from Google, including its Maps and Earth platforms, were used by both official bodies and the public to collect or disseminate spatial data related to the event. This included the loading of high-resolution aerial imagery into Google Earth by NOAA, and additionally an early grassroots example of a map “mashup” where survivors posted details of their locations or other useful information (Figure 1.5). The relationship between technology platforms, urban areas, and their inhabitants is an enduring feature of contemporary urban living, and a key facet of urban analytics relates to the use of these new spatial data infrastructures for decision making.
Figure 1.4 Population change in New Orleans between 1950 and 2014
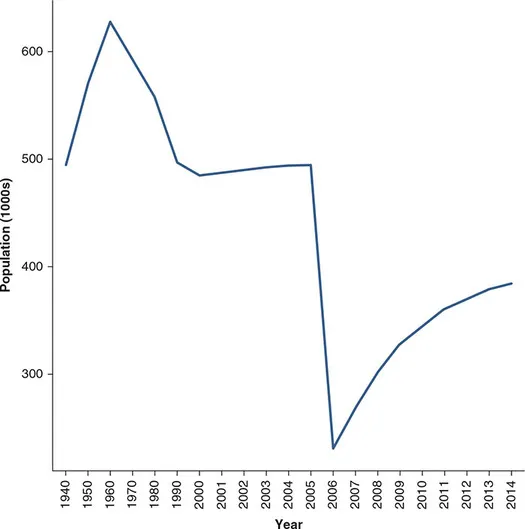
Source: Authors’ own; data – US Census Bureau, Population of the Largest 100 Urban Places 1940–2016
Figure 1.5 An early map “mashup” created in the aftermath of Hurricane Katrina
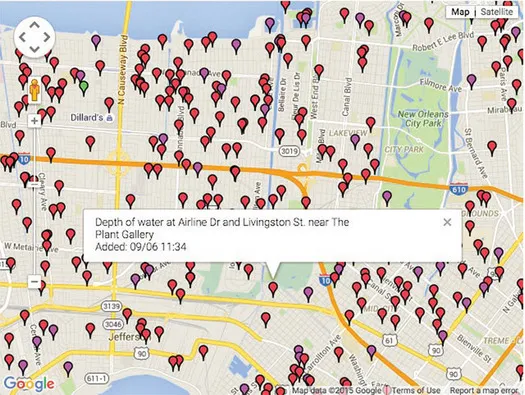
Source: Website was developed by Jonathan Mendez and Greg Stoll and an archive of the site is available online (http://www.gregstoll.com/scipionus)
Urban Data Systems
New York City (NYC) is situated on the north-eastern seaboard of the United States of America, and is the country’s most populated city, with the 2010 Census recording over 8 million residents. As with many large metropolitan areas across the globe, technology and data are increasingly embedded into the fabric of the urban area making up NYC.
Figure 1.6 shows a photograph of a fairly typical street scene occurring within Times Square, which is located within the Mid-Town district on the island of Manhattan. People can be seen intermingling with traffic, and theaters, cinemas, and shops line the pedestrianized area, with residential and office towers dominating the skyline. However, beyond the obvious visible features, various technologies infiltrate multiple aspects of urban living and mobility.
Way beyond the visible range of the optics used on the camera that took this photograph, and at approximat...