
eBook - ePub
Compendium of Health Statistics
2008
Emma Hawe, Francois G. Schellevis
This is a test
Buch teilen
- 309 Seiten
- English
- ePUB (handyfreundlich)
- Über iOS und Android verfügbar
eBook - ePub
Compendium of Health Statistics
2008
Emma Hawe, Francois G. Schellevis
Angaben zum Buch
Buchvorschau
Inhaltsverzeichnis
Quellenangaben
Über dieses Buch
"The OHE Compendium of Health Statistics" is the one-stop statistical source specially designed for easy use by anyone interested in the UK health care sector and the NHS. It contains over 300 simple, easy-to-read tables and charts and provides a wide range of information on UK health and healthcare, demography, expenditure and major illness in a single volume. It also includes long time series and comparisons with other economically developed nations. The UK data are broken down into England, Northern Ireland, Scotland and Wales and contain annual figures from as far back as 1949 (the first full year of the NHS). An on-line version of the "OHE Compendium" is also available.
Häufig gestellte Fragen
Wie kann ich mein Abo kündigen?
Gehe einfach zum Kontobereich in den Einstellungen und klicke auf „Abo kündigen“ – ganz einfach. Nachdem du gekündigt hast, bleibt deine Mitgliedschaft für den verbleibenden Abozeitraum, den du bereits bezahlt hast, aktiv. Mehr Informationen hier.
(Wie) Kann ich Bücher herunterladen?
Derzeit stehen all unsere auf Mobilgeräte reagierenden ePub-Bücher zum Download über die App zur Verfügung. Die meisten unserer PDFs stehen ebenfalls zum Download bereit; wir arbeiten daran, auch die übrigen PDFs zum Download anzubieten, bei denen dies aktuell noch nicht möglich ist. Weitere Informationen hier.
Welcher Unterschied besteht bei den Preisen zwischen den Aboplänen?
Mit beiden Aboplänen erhältst du vollen Zugang zur Bibliothek und allen Funktionen von Perlego. Die einzigen Unterschiede bestehen im Preis und dem Abozeitraum: Mit dem Jahresabo sparst du auf 12 Monate gerechnet im Vergleich zum Monatsabo rund 30 %.
Was ist Perlego?
Wir sind ein Online-Abodienst für Lehrbücher, bei dem du für weniger als den Preis eines einzelnen Buches pro Monat Zugang zu einer ganzen Online-Bibliothek erhältst. Mit über 1 Million Büchern zu über 1.000 verschiedenen Themen haben wir bestimmt alles, was du brauchst! Weitere Informationen hier.
Unterstützt Perlego Text-zu-Sprache?
Achte auf das Symbol zum Vorlesen in deinem nächsten Buch, um zu sehen, ob du es dir auch anhören kannst. Bei diesem Tool wird dir Text laut vorgelesen, wobei der Text beim Vorlesen auch grafisch hervorgehoben wird. Du kannst das Vorlesen jederzeit anhalten, beschleunigen und verlangsamen. Weitere Informationen hier.
Ist Compendium of Health Statistics als Online-PDF/ePub verfügbar?
Ja, du hast Zugang zu Compendium of Health Statistics von Emma Hawe, Francois G. Schellevis im PDF- und/oder ePub-Format sowie zu anderen beliebten Büchern aus Medicine & Public Health, Administration & Care. Aus unserem Katalog stehen dir über 1 Million Bücher zur Verfügung.
Information
Population, mortality, morbidity and lifestyle statistics
Main Points
- Life expectancy at birth in England and Wales has increased over the last two decades by 5.0 years for men and 3.3 years for women.
- Partly as a consequence of that, the UK population is ageing. Of the 60.6 million in population 2006, 16.0% were aged 65 and over and 7.7% were aged 75 and over.
- Within the UK, life expectancy is highest in England and lowest in Scotland with a difference between them of about two years for both sexes.
- Circulatory diseases remain the most common cause of death in the UK, accounting for almost 36% of all deaths.
- The UK has higher death rates from coronary heart disease and breast cancer than most EU countries, with Scotland also having relatively high mortality from lung cancer and stroke.
Population
In 2006 the UK population was 60.6 million, of whom 83.8% lived in England, 8.4% in Scotland, 4.9% in Wales and 2.9% in Northern Ireland (Table 1.2 and 1.4 to 1.7). The UK total has increased by 2.4 million (4.2%) over the past decade (Table 1.1). The UK is not alone in its growth; many OECD1 and EU2 countries continue to experience an increase in population size (Table 1.9), with some countries, such as Turkey and Mexico, growing appreciably faster than the UK. Current predictions suggest that by 2051, the UK population will rise to 77.2 million (Table 1.2).
Table 1.8 shows that population growth has not been equal within the UK over the last decade. The population in England increased by 4.6 per cent, Northern Ireland by a similar 4.8 per cent, Wales by only 2.6 per cent and Scotland only 0.5 per cent.
Changes in population size are driven by the net difference between the birth and death rate, known as natural change, net migration and other changes such as the number of armed forces and their dependents resident in the UK. Since the 1990s, migration has become a major factor affecting the UK population size (Box 1).
Box 1 Components of change in population size, UK 1951-2021
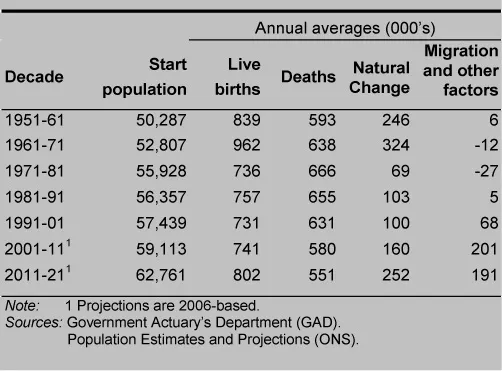
The live birth rate has generally declined since its postwar peak in 1964 at the height of the baby boom. There were 723,000 UK births in 2005, the highest number since 1997 (Table 1.19). In parallel, the total period fertility rate for the UK has also increased in recent years, reaching 1.79 in 2005, compared to an all time low of 1.63 in 2001. However, this is still below the typically quoted fertility level required for population replacement of 2.1.
Box 2 shows the changing distribution of the UK population. In 2006, the number of individuals in the elderly age groups was considerably greater than half a century earlier, and the number of children somewhat lower.
Box 2 Age distribution of UK population, by age and gender, 1956 and 2006.

Box 3 Decadal change (per cent) in the age distribution of the UK population
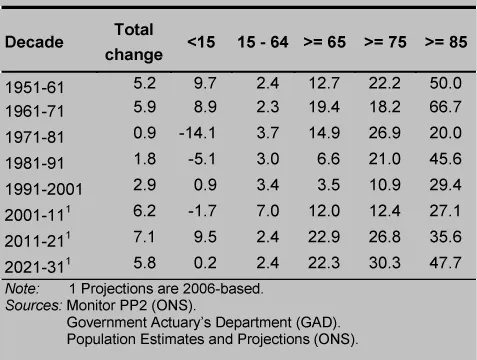
The elderly population has been increasing throughout this period (Box 3). In 2006 approximately one in six individuals in the UK were 65 or older, compared to just one in nine 50 years earlier (Table 1.1). This is predicted to rise yet further, to an estimated one in five by 2021. There has also been a dramatic increase in those 85 or older, with 1.2 million in 2006 (Figure 1.1 and Table 1.1). Within the UK, Wales has the largest proportion of elderly people and Northern Ireland the smallest (Table 1.8). In contrast there has been a decline in the proportion of children in the UK population over the past decade. Those aged 0-14 represented 17.7% of the UK population in 2006, compared to 23.2% 50 years earlier (Table 1.1).
In 2005 the dependency ratio, the number of individuals aged >65 or <15 per 100 people aged 15 to 64, stood at 52 in the UK (Table 1.10). This is in line with the dependency ratios observed for the majority of other EU and OECD countries. However, there is considerable spread in dependency ratios, ranging from 39 in Korea to 58 in Mexico.
The median age3 in the UK rose to 38.9 in 2005, this is in line with the majority o...