![]()
1
ENVIRONMENTAL MEASUREMENT
The environment in which we live and work includes both a social and a physical component. Yet, because of the nature of professional study, there appears to be an arbitrary division between the two. There are the architects who shape the structure of the physical environment to make “places.” And there are social scientists who have focused on the characteristics of a group of people living in a particular “place.” Ostrander (1974) describes the problem as “the visual-semantic communication gap.” It is his contention that social scientists are analytical thinkers, separating things into parts and subsequently looking for relationships between these parts. Designers, on the other hand, combine the parts into a unified whole. Recently, however, there has emerged an awareness of the interaction between the two components. However, one of the problems of integrating the two dimensions stems from the problems in social science practice, which attempts to investigate people’s perceptions of the environment without structuring those perceptions. But, in fact, quite often the questions used in an interview organize and influence the perceptions of those interviewed.
Different approaches have been used to resolve this dilemma. One approach is to accompany residents on a community walk, asking particular questions about the environment. A direct comparison in a study by Lowenthal and Riel (1972) indicated that representational systems for directly experienced places and for images of places were similar. Another approach is to have people describe their environment by drawing maps of where they live (Gould & White, 1974). The assumption behind these studies is that cognitive maps of the environment are acquired predominantly through direct experience. Knowledge is gained about the perceptual characteristics of places by walking from one place to another (Gärling & Golledge, 1989). Yet another approach has been through interviews using photographs of the environment to generate insights about resident familiarity (Greenbie, 1976) and preferences (Zube et al., 1975; Sanoff, 1970a). Generally, the results of studies of images appear to be similar to those obtained in studies of direct place experiences (for example, Ward & Russell, 1981). However, even though the methods used to represent a place may be the same, a particular place may not be perceived exactly as it has been remembered. Changing conditions from one occasion to another may cause forgetting to occur (Mainardi-Peron, Baroni, Job, & Salmaso, 1985). Using photographic images as a basis for interviewing lies somewhere between use of verbal questions and conducting community walks.
Questionnaires and interviews can draw on a wide range of visual media. Photographs contain a vast resource of information and are often less ambiguous than words. There are certain situations where photographic images are appropriate for interviewing and others where drawings or models would be appropriate. There are always questions of reliability, such as the relationship between a visual image and the phenomenon it was intended to record, or people’s ability to read the images. These questions of technique will continue to plague researchers, but first there must be recognition of the significance of visual images, while questions about their meanings continue to be raised.
Images used to represent the environment consider certain visual features as sources of aesthetic value. These values, such as visual quality, are not only a natural resource, but often the basis for public policy initiatives. The importance of visual quality has been recognized by such initiatives as the National Environmental Policy Act (1969) and the Coastal Zone Management Act (1972), as well as architectural review boards, downtown improvement associations, and other organizations. Furthermore, the United States Supreme Court has cited aesthetic criteria alone as an adequate basis for development (Pearlman, 1988). Therefore, discussions of environmental quality, in this context, refer to visual-aesthetic quality in the physical environment. This includes the scenic quality of the urban environment and scenic landscapes in the non-urban environment.
Appraisal measures the interaction between the human observer and the visual environment. Observer-based assessments of environmental quality consist of preferential judgments and comparative appraisals (Craik & Zube, 1976). Preferential judgments represent subjective reactions to specific environments, while comparative appraisals judge the quality of specific environments against a standard of comparison (Craik & McKechnie, 1974).
The environment can be represented by different modes. Although verbal descriptions have been used to represent the environment, direct and indirect methods decrease the possibility for misrepresentation. One method is to present the relevant features of the environment directly to observers. Direct representations may be made in the natural setting, thus minimizing opportunities for error when environments are represented by simulations. The major problem is the difficulty in controlling extraneous factors that may affect the observer’s judgment.
Indirect representations are used most often and vary widely with the features of the environment being studied. Graphic representations are used where visually perceived properties of the environment are being assessed.
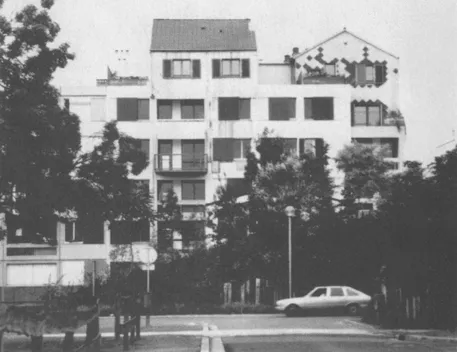
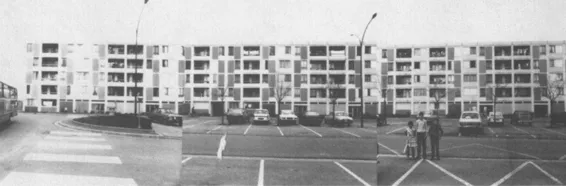
Specific measures should be taken to ensure unbiased representation using indirect methods. Since observers’ judgments will be based on their interpretations of the represented environment, the quality of the representation is critical. The represented environment should reflect the properties and characteristics of the actual environment to be assessed. Comparative appraisals of visual displays are particularly sensitive to the slightest variation in the characteristics they represent. For example, Figures 1-1A and 1B are photographs of different buildings serving the same purposes. In Figure 1A, the building is placed in a landscaped setting, while in Figure 1B, the setting is barren. Comparative judgments of the buildings will undoubtedly be biased by the influence of the setting on the overall appearance of the buildings.
One of the unresolved problems of visual research is the measurement of properties chosen for study. Typically, this research has “completely sidestepped this problem, by the expedient of selecting environmental sites, views, structures, paths, or verbally designated locales or regions, without any attempt to assess these with respect to specific variables of the stimulus” (Wohlwill, 1976). Environmental images are usually presented, in the form of photographs or slides, to subjects who rate them on a large number of rating scales. The outcome of such studies tends to be descriptive of the way people respond verbally to environmental images, without necessarily establishing relationships among physical variables. These relationships need to be identified and assessed, and sometimes isolated, independently of the evaluative responses made to them.
Objective measures of physical characteristics of the environment that are related to human factors are typically temperature, noise level, and, in the visual area, brightness. The variables most relevant for studying the visual environment tend to be qualitative. Often, the factors measured, such as complexity, tend to be very abstract. Examples of more concrete features of the environment are provided in the landscape-feature checklist employed in the Connecticut River Valley study of Zube (Zube, Pitt, & Anderson, 1974). Shafer (1969) described natural landscape configurations with a total of forty-six variables, which included combinations of zones (such as sky, vegetation, lake, and so on) in order to obtain groupings of physical factors to predict preference judgments.
Figure 1-1a: Building a landscaped setting (Photo: Lucien Kroll).
Figure 1-1b: Building in a barren setting (Photo: Lucien Kroll).
Although most physical methods involve a certain degree of personal judgment, there are situations that require the use of human judges to assess features of the visual environment. To be effective the scales should refer to the attributes of the environment rather than to subjective experiences. Landscape rating scales developed by Craik (1972) and landscape quality ratings used by Zube (Zube, Pitt & Anderson, 1974) reflect the subjective approach with reliable results. Zube’s Scenic Quality scale (1976) uses landscape dimensions, such as topographic texture, land use diversity, percentage of tree cover, and so forth, which have a clear environmental referrent compared to scales such as pleasant-unpleasant, or ugly-beautiful, which refer to the individual’s affective response.
Image selection, too, is in need of considerable clarification. Image sampling, as opposed to sampling of subjects, has largely been ignored. This was primarily a result of a history of research based on laboratory experimentation where the image or stimulus was constructed to represent the variables to be manipulated. As a result, the issue of sampling has rarely arisen. Representative sampling of environments is problematic because it is intended to arrive at a set of images that accurately correspond to attributes of the larger whole. Generalizability of results depends on successful sampling of images or stimuli. Brunswik (1956) argued for sampling of the environment in order to capture the range of conditions that typically confront the observer. Representative sampling was rejected by Hochberg (1966), who preferred the systematic variation of stimuli that are experienced in the environment. Wohwill (1976) suggested identifying the major variables in specific locales, necessitating prior investigation of sites included in the sample to establish environmental variables.
MULTIPLE SORTING
A number of different studies have demonstrated the potential of multiple sorting in establishing people’s ratings of a variety of elements and situations (Canter, Brown, & Groat, 1985). Rather than suggesting a set of bipolar dichotomies or numerical weightings which can be applied to tested items, the technique allows people to sort items freely, according to their own criteria, into as many categories as they can describe. This type of sorting establishes not only the actual distribution of elements, but also reveals personal categorization schemes and related meanings and associations. Results may be more valid in determining human responses than those obtained when the tester supplies categories and values, and can suggest the important issues and aspects of the research itself.
The technique is simple, and can be carried out by giving subjects a set of elements and general instructions, such as those below. The italics indicate where instructions are likely to change with different research questions and procedures.
We are conducting a study of people’s thoughts and feelings about landscapes. So we are asking a number of people chosen at random to look at the following pictures and sort them into groups in such a way that all the pictures in a group are similar to each other in some way and different from those in other groups. You can put any picture into as many groups as you like and include as many pictures in each group as you like. It is your ideas that count.
When you have finished a sorting, we would like you to tell us the reasons for your sorting and what it is that the pictures have in common. After you have sorted the pictures once, we will ask you to do it again, using any other principles you can think of. You may continue sorting as many times as you can think of categories that are useful. Please tell us whatever thoughts you may have as you are sorting the pictures.
Multiple sorting was used by Bishop (1983) to determine whether the age of buildings was significant in people’s views of their surroundings. Using the set of photographs provided, thirty to thirty-five people tested did use age as a basis of sorting, but only eight used it in the first sort. Bishop was able to categorize the type of age sorting that occurre...