Although the main purpose of this book is to describe proper sample handling techniques for infrared analysis, a cursory understanding of how an infrared spectrum is generated is useful. This chapter covers infrared theory in a limited fashion, since numerous texts cover this material in great detail.1, 2, 3, 4, 5
By understanding the theory, it is possible to see how the infrared spectra of complex molecules can be interpreted. It then becomes possible to see how the infrared spectrum of a material can be different depending on the state of the molecule (i.e., solid, liquid, or gas). This ultimately speaks to experimental realities associated with sample handling techniques. When a sample is dissolved in solvent and the spectrum is run in a solution cell, the solvent that is used may hydrogen bond with the sample and cause bands in the spectrum to shift. When a sample is ground, mixed with potassium bromide (KBr) and pressed to form a pellet, there can be shifts in the band frequencies due to reaction between the sample and the alkyl halide which can occur from the pressure used in making the pellet. If the same sample is ground and mixed with KBr, but the spectrum is run by diffuse reflectance, the band frequencies may not be shifted in the same manner that they were in the KBr pellet. When a sample is analyzed using gas chromatography/Fourier Transform Infrared (GC/FT-IR) the resulting spectrum is that of the vapor phase of the compound. That spectrum, with its sharp narrow lines, looks very different than the condensed phase spectrum of the same material. Not only the physical state of the sample, but also the manner in which the sample is diluted, the accessory used to obtain the spectrum, and the care that is employed in the sample preparation can have large effects on the characteristics and quality of the resulting infrared spectrum.
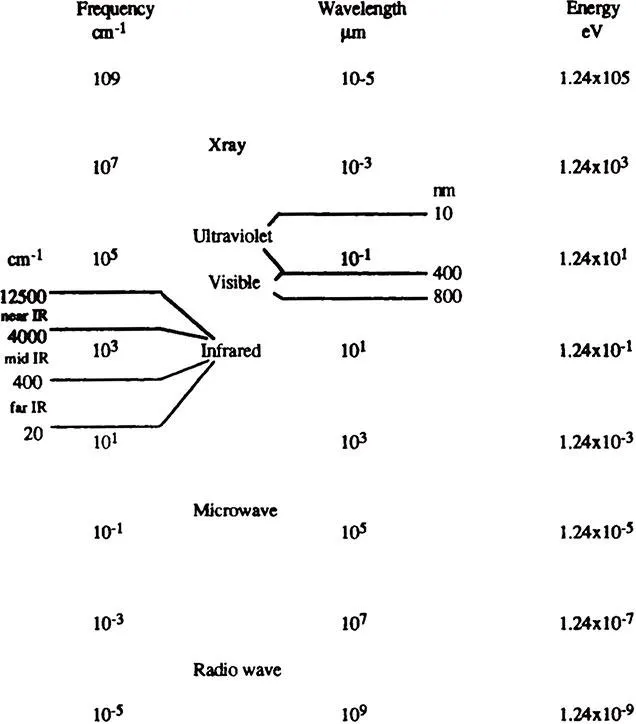
Spectroscopy is the study of the interaction of electromagnetic radiation with matter. Electromagnetic radiation can be divided into different regions of energy that correspond to different spectroscopic techniques (see Figure 1). The region from 4000 to 400 cm−1 is considered the mid-infrared region where vibrational and rotational bands are observed. Sampling techniques for the mid-infrared region are covered in this book.
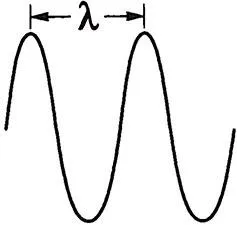
Classical theory described electromagnetic radiation as a continuous wave, as shown in Figure 2. This wave can be described in terms of its frequency or its wavelength which are related to each other in terms of the speed of light, as shown in Equation 1. Classical theory explained properties of electromagnetic radiation, such as refraction, diffraction, and other optical phenomena. Quantum mechanical theory described electromagnetic radiation as particles with energy that can only occur at discrete levels. This theory can be used to explain absorption and emission of electromagnetic radiation. The discrete particles (called photons) have no resting mass and energy equal to hv where h is Planck’s constant, as shown in Equation 2. Most properties of radiant energy can be explained in terms of this dual wave-particle behavior of electromagnetic radiation. Equation 2 shows that energy is proportional to frequency, while Equation 3, which is derived from Equations 1 and 2, shows that it is inversely proportional to wavelength. Thus, the shorter the wavelength the higher the energy.
| (4) |
The total energy of a molecule is due to electronic, vibrational, and rotational contributions, as described by Equation 4. The electronic component is due to state-to-state electron transitions. These processes usually generate ultraviolet and/or visible spectra. For example, the 589 nm line of sodium in a flame is due to the first excited state of sodium as the electron goes from a 3p1 state to a 3s1 state. Vibrational energy is due to changes in the internuclear distance of two or more atoms. This process may generate an infrared spectrum. Rotational energy is due to changes in the molecule as it rotates around its center of mass. This process often results in fine structure superimposed on vibrational bands; it is usually only observed for small, gaseous molecules in the infrared, the far-infrared, or the Raman. For larger, condensed phase molecules the fine structure from the rotational bands is broadened to the point where it is generally not observed.
The manner in which molecules absorb electromagnetic radiation can be explained in terms of an analogy that takes into consideration both the classical and the quantum mechanical models. The molecule can be viewed as made up of springs connected to balls to represent the bonds that connect the atoms. The springs obey Hooke’s law for a harmonic oscillator, that is, the force that the spring exerts on the ball is proportional to the displacement from the equilibrium state. The simplest diatomic molecule with an internal vibrational frequency can be modeled as two balls, of mass m1 and m2, connected by a spring. The oscillation frequency can be calculated using Equation 5, where k = force constant and mr = the reduced mass of the atom. Reduced mass is calculated from the individual atomic masses, m1 and m2 using Equation 6.
If mass m1 is small, such as for a hydrogen atom attached to heavier atom such as carbon, the reduced mass in Equation 6 is approximately equal to m1, the mass of hydrogen, and the frequency becomes that of a point oscillator. The hydrogen atom behaves as if it were a ball connected by a spring to an immovable wall, rather than two balls that are connected by a spring. This approximation is useful for predicting frequencies of hydrogen stretching vibrations.
If there are no losses due to friction, the harmonic oscillator will remain in motion with constant energy. This energy is the sum of the kinetic and potential energy of the system. As the balls move on the spring, the relative amount of potential and kinetic energy changes depending on their specific location. Assuming that the model obeys Hooke’s law, the potential energy of the molecule is given by Equation 7, a parabolic function.
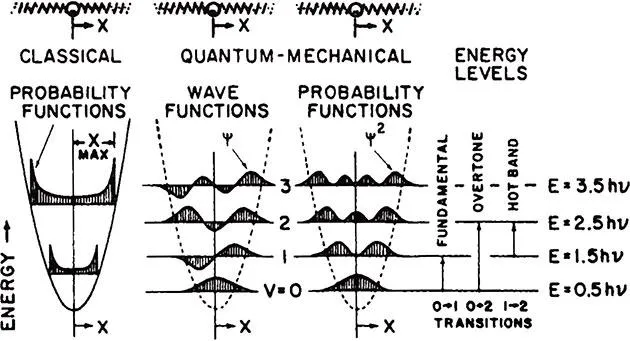
When the atoms are at the equilibrium state, the kinetic energy of the molecule is zero. As an atom moves to displacement Xmax the total energy is equal to the potential energy. Since the total energy is dependent only on the force constant and the displacement, a continuum of energy levels are allowed, as shown in Equation 8. This is the distinguishing mark of the classical harmonic oscillator model. The energy and probability function for the classical harmonic oscillator is shown in the left part of Figure 3.