
Macroeconomics in Context
A European Perspective
Sebastian Dullien, Neva Goodwin, Jonathan Harris, Julie Nelson, Brian Roach, Mariano Torras
- 688 Seiten
- English
- ePUB (handyfreundlich)
- Über iOS und Android verfügbar
Macroeconomics in Context
A European Perspective
Sebastian Dullien, Neva Goodwin, Jonathan Harris, Julie Nelson, Brian Roach, Mariano Torras
Über dieses Buch
Macroeconomics in Context: A European Perspective lays out the principles of macroeconomics in a manner that is thorough, up to date, and relevant to students. With a clear presentation of economic theory throughout, this latest addition to the bestselling "In Context" set of textbooks is written with a specific focus on European data, institutions, and historical events, offering engaging treatment of high-interest topics, including sustainability, Brexit, the euro crisis, and rising inequality. Policy issues are presented in context (historical, institutional, social, political, and ethical), and always with reference to human well-being.
This book is divided into four parts, covering the following key issues:
- The context of economic analysis, including basic macroeconomic statistics and tools;
- The basics of macroeconomic measurements, including GDP, inflation, and unemployment, as well as alternative measures of well-being, and the particular structures of the European economies;
- Methods for analyzing monetary and fiscal policy, including an in-depth coverage of the instruments and approaches of the European central bank and some coverage of an open economy;
- The application of the tools learnt to selected macroeconomic issues, such as the euro crisis, the global financial crisis, public debt, global development, and environmental sustainability.
Far more than any other existing macroeconomic textbook, this book combines real-world relevance of the topics covered with a strong focus on European institutions and structures within an approach that explains multiple economic paradigms. This combination helps to raise students' interest in macroeconomics as well as enhance their understanding of the power and limitation of macroeconomic analysis.
Visit http://www.bu.edu/eci/education-materials/textbooks/macroeconomics-in-context-a-european-perspective/ for online resources for both lecturers and students.
A video of a panel discussion about the book can be found at https://youtu.be/xjHJrW9WP44.
Häufig gestellte Fragen
Information
Part I
The Context for Economic Analysis
Chapter 0
Macroeconomics and Well-Being
Notes on Graphs
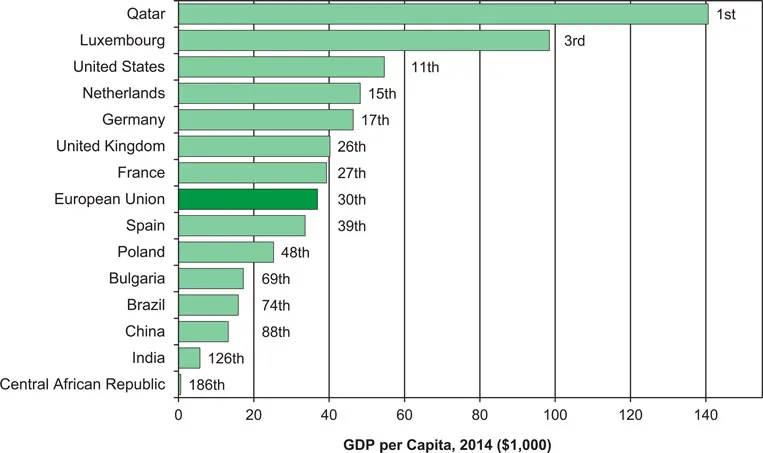
- Figure 0.1 GDP per Capita, 2014 (Thousands of Dollars)
- Figure 0.2 Growth in GDP per Capita, 2005–2014 (Percent)
- Figure 0.3 Net National Savings Rate, 2014 (Percent of GNI)
- Figure 0.4 Government Debt (Percent of GDP)
- Figure 0.5 Labor Productivity, 2014 (GDP per Hour Worked)
- Figure 0.6 Average Annual Hours Worked, 2014 (Lowest to Highest)
- Figure 0.7 Unemployment Rate, 2014 (Percent of Labor Force, Lowest to Highest)
- Figure 0.8 Average Annual Inflation Rate, 2005–2014 (Lowest to Highest)
- Figure 0.9 General Government Revenue, 2014 (Percent of GDP)
- Figure 0.10 Trade Balance (Percent of GDP)
- Figure 0.11 Gini Coefficient (Most Equal to Least Equal)
- Figure 0.12 Percent of Population Living Below $1.90/Day Poverty Line, 2012
- Figure 0.13 Official Development Assistance, 2015 (Percent of GNI)
- Figure 0.14 Internet Users per 100 People, 2014
- Figure 0.15 Average PISA Science Test Score, 2012 (15-year-olds)
- Figure 0.16 Life Expectancy at Birth, 2015
- Figure 0.17 Average Life Satisfaction, 2010–2014 Results (1 = Dissatisfied, 10 = Satisfied)
- Figure 0.18 Carbon Dioxide Emissions per Capita, 2011 (Metric Tons per Year)
- Figure 0.19 Average National Particulate Matter Concentration, 2013 (Micrograms per Cubic Meter)
- What it is: Media stories of economic performance frequently refer to gross domestic product (GDP). A country’s GDP per capita measures economic production per person per year, which gives us an idea of the average material living standards in the country. While GDP is perhaps the most commonly used macroeconomic metric, it does not necessarily measure well-being. We discuss how GDP is calculated in Chapter 5 and the limitations of and alternatives to GDP in Chapter 6.
- The results: European Union countries cover a wide range in the ranking. Luxembourg ranks third, with a GDP per capita of around $98,000. Bulgaria ranks 69th, with a GDP per capita of $17,000. Were the EU one country, it would rank 30th, with a GDP per capita of around $37,000. In 2014, a year with still high oil prices, oil-producing Qatar had the world’s highest GDP per capita at around $141,000, and the Central African Republic had the lowest, at only $590.
- What it is: In macroeconomics, we seek to explain not only why some countries have a higher GDP per capita but also what conditions lead to strong GDP growth rates. In this graph, we compare the growth in GDP per capita, after adjusting for inflation, across countries over the 10-year period 2005–2014. We discuss measuring GDP growth rates in Chapter 5 and theories of GDP growth in Ch...