![]()
PART I
Labor, Power, and Inequality in Boston
![]()
CHAPTER 1
Unshared Growth
Earners and Earnings Inequality in Boston Before and After the Great Recession
Randy Albelda, with Aimee Bell-Pasht, MA, Urata Blakaj, MA, Trevor Mattos, MA
Boston is the economic hub of New England, led by its world-renowned educational institutions, hospitals, high-tech and biotech companies, and large financial sector. Boston’s current industrial mix is relatively new. James Green and Hugh Donahue foresaw these changes forty years ago, when they argued that the city was starting to transform for working-class Bostonians by the late 1970s. As the city lost manufacturing jobs, it saw a rise in lower-waged office and service work in the financial and health-care sectors.1 Boston is a global city, and its growth is consistent with that of other such cities, as described by Saskia Sassen: thriving financial, health, and knowledge service industries, employing a class of highly paid professionals and managers that is undergirded by a substantial sector of low-wage service sector workers.2 This is a recipe for strong growth but also for economic inequality. The severe Great Recession in the first decade of the 2000s, characterized by a financial crisis followed by cuts to the public sector (including education and health), had the potential to disrupt Boston’s growth and inequality trajectory. Comparing data from before the recession (2005–2007) to the 2013–2015 period, it is clear that Boston has weathered this storm in terms of overall growth in economic state activity, employment, and inflation-adjusted earnings. But as has been the case since the late 1970s, this growth has not been shared equally within Boston or across the state.
In this chapter, we provide a snapshot of employed workers that live in Boston compared to those that live in Boston suburbs and the rest of Massachusetts in the period 2013–2015. Not surprisingly, Boston’s wage earners are much more diverse in terms of race, ethnicity, and nativity than those in the Boston suburbs and the rest of Massachusetts. We then compare earnings levels and earnings shares before and after the Great Recession by lower-wage, median, and higher-wage workers (at the 20th, 50th and 80th percentiles). We find that, while on average, workers that live in Boston and its suburbs saw their real (inflation-adjusted) earnings increase over these two periods, that growth was very uneven, with the top 20 percent seeing the most growth and those in the middle losing earnings shares.
We then turn our attention to Boston’s most vulnerable workers by exploring the percentage of workers that are low wage (defined here as those earning two-thirds of median hourly wages in the state) and low income (defined as those earning 200 percent of the federal poverty line income threshold). We find that almost one out of every three workers who live in Boston earns low wages and one in five is in a low-income family; beyond this, 36 percent of workers either earn low wages or live in low-income families. In spite of the economic growth that took place during the recovery from the Great Recession, we find that these percentages have not changed since the crisis of 2007–08, reaffirming the early findings that the lion’s share of increased post-recession earnings went to those workers at the top of the earnings ladder.
Finally, we take a look at the change in the job and demographic characteristics of working-class workers living in Boston before and after the recession. Here, we use “working class” to describe workers over twenty-five years of age with less than a bachelor’s degree.3 Under that definition, we find that this group of workers has shrunk in Boston. However, there has been a shift in its composition. The number of construction and manufacturing workers has declined as has sales and administration workers, but there was an increase in the number of service workers. The working class living in Boston is also less white than it was in 2005–2007 and also older.
Boston is a highly unequal city, with the top 20 percent of earners holding the majority of earnings, and the Great Recession has not put a damper on that. And because the top 20 percent of earners garnered the majority of the income gains between the 2005–2007 and 2013–2015 period, the city’s inequality has only increased. The majority of Boston’s working-class workers are people of color and about half work in services, as opposed to the traditional blue-collar (manufacturing, transportation, and construction) or pink-collar (retail trade and administrative support) occupations described by Green and Donahue. These changes represent new challenges but also point to the direction of the types of organizing and organizers that will be most effective. Stemming the tide of inequality will require promoting wage growth in service jobs and leadership and organizing strategies that reflect that Boston’s working class is majority minority.
Boston’s Workers: A Snapshot
Most of the data in this chapter come from three-year samples of the US Census Bureau’s American Community Survey (ACS), using 2013–2015 for the post-recession period and 2005–2007 for the earlier period. We chose these two time periods in order to compare workers at comparable peak economic periods.4 Specifically we look at workers eighteen years and older who reside in Massachusetts, as represented in the Public Use Micro Sample (PUMS) data from 2005 to 2007 and 2013 to 2015. These combined data sets allow us to get a large enough sample of workers living in Boston to confidently make comparisons across the state and over time.5
In exploring worker characteristics, we look only at residents of the geographic area we explore. So, all data presented for Boston are for workers who live in Boston, regardless of where they work. We compare characteristics over these two time periods as well as across three geographic areas of Massachusetts: the city of Boston, the Boston metro region (which we refer to as the Boston suburbs), and the rest of the state which includes both rural areas as well as many cities, notably Fall River, Holyoke, Lowell, Lawrence, New Bedford, Pittsfield, Springfield, and Worcester. In the 2013–2015 period, just under 10 percent of all Massachusetts workers lived in Boston, 49 percent lived in Boston’s suburbs, while 41 percent lived in the rest of Massachusetts.
The ACS data are cross-sectional, meaning they only explore a sample of the population at a point in time. That means we are not comparing the same individuals over the two periods. Therefore, we do not know if the changes in earnings we find are due to a change in the composition of workers residing in Boston or a change in the level of earnings of workers who lived in Boston in the earlier period. For example, the percentage of Boston workers with a college degree increased over the two periods. However, we do not know if this is because more workers who lived in Boston in 2005–07 earned their college degrees, if more people with college degrees moved into Boston after 2007, or if those without a college degree moved out. Cross-sectional data are useful, however, in delineating the trends in inequality and how the composition of workers, the jobs they hold, and earnings they receive have changed over time.
Finally, we primarily look at workers’ annual earnings, the amount of wages, salaries, or income from self-employment workers reported over the twelve months before they were surveyed by the ACS census takers. We only include workers with non-zero earnings, which means we exclude people who report that they had no earnings in the previous twelve months. We do, however, include those that report having negative earnings.6 We adjust all earnings to 2015 price levels.
The Demographic and Employment Characteristics of Boston Workers
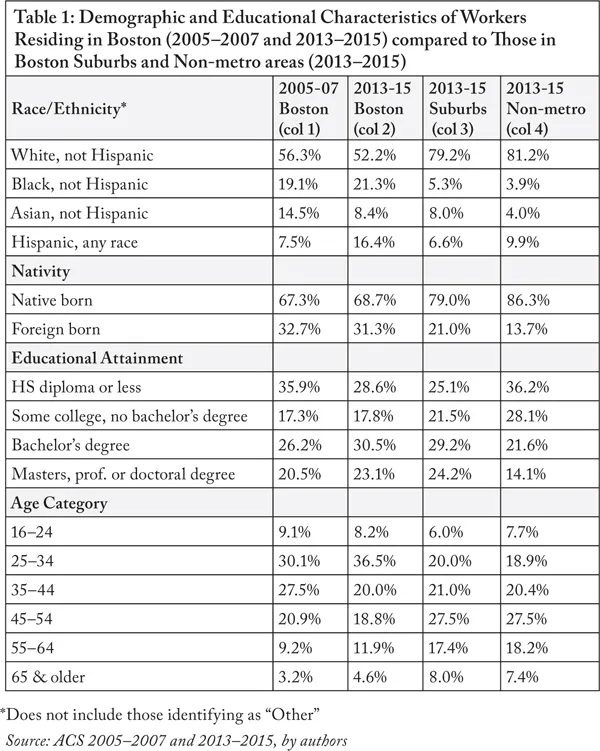
Between the two time periods under investigation here, the number of workers who lived in Boston grew 9 percent, from 286,078 in 2005 to 314,520 in 2013, while the total number of workers in the state has grown 3.4 percent over the same period, from 3,142,022 to 3,265,783. Table 1 provides a demographic profile of workers in Boston across the two time periods, along with workers living in Boston’s suburbs and the non-metro region in 2013–15. The sex composition is not depicted because it is unchanged and does not differ much across the three regions: 48 percent of all Massachusetts workers are female.
The racial, age, and education composition of workers who live in Boston has experienced some notable changes between 2005 to 2007 (column 1) and 2013 to 2015 (column 2). There are a larger percentage of Black and Latino workers and smaller percentages of white and Asian workers now than before the recession. A higher share of earners have higher levels of education: 46.8 percent of workers living in Boston have at least a bachelor’s degree in the 2005 to 2007 period while 53.6 percent do in the 2013 to 2015 period. The percentage of immigrant workers has decreased slightly, with just under one out of every three workers born outside the United States. There are higher percentages of workers ages 55 and older as well as ages 25-34 who lived in Boston today than in 2005 to 2007.
Workers who lived in Boston in 2013 to 2015 (column 2) were much more diverse in terms of race, ethnicity, and nativity compared to those who lived in its suburbs (column 3) and the rest of the state (column 4). Workers who live in the suburbs are only slightly more likely to have higher education levels than those in Boston, while those who live in the non-metro regions have the lowest levels of educational attainment. Almost two-thirds (64.3 percent) of non-metro workers do not have a bachelor’s degree. Boston is the home to a much higher percentage of workers ages 25–34 than the suburbs and almost twice as many as in non-metro regions. Conversely, older workers (55 and older) are a considerably smaller share of workers in Boston.
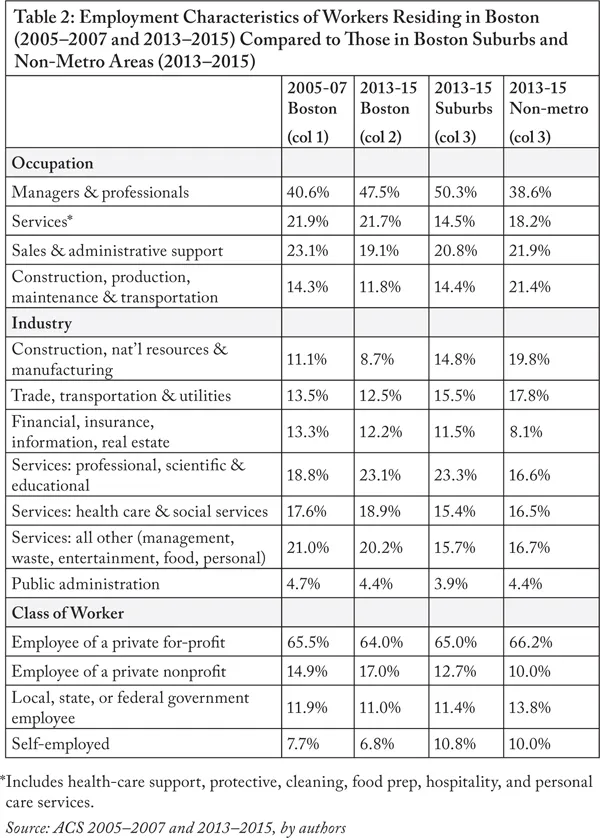
Table 2 depicts the distribution of workers by occupation, industry, and class of work. The distributions of workers who live in Boston over the two time periods are in columns 1 and 2 while those in Boston suburbs and the non-metro region are in columns 3 and 4. Occupation refers to the type of work performed, regardless of employer; industry classifies workers by product produced by their direct employer; class of work refers to the ownership classification of a worker’s direct employer. For example, a clerical worker who works for Massachusetts General Hospital in Boston would be classified under the occupation of administrative support, in the health-care services industry, and as an employee of a nonprofit.
Boston (and the immediate surrounding area) has well-developed and relatively high-paying financial, medical, and knowledge industries. And as Sassen argues, workers in these higher-paying industries demand and rely on a host of paid services, especially in low-wage food, hospitality, care, cleaning, and protective service industries and occupations.7 We would expect to see the shares of employment of professional and service workers rise (or fall) together. However, looking at the change in occupational characteristics over the two time periods in Boston, there has been a large increase (7 percentage points) in the portion of workers who are white-collar managers or professionals, with declines in blue-collar jobs in construction, production, maintenance, and transportation as well as in pink-collar jobs in retail and administrative support, with the share in service occupations staying at about 22 percent. This trend is somewhat mirrored in the industry distribution, with the largest growth in workers employed in high-wage services (professional, scientific and educational services) industries and the largest decline in workers employed in construction and manufacturing industries. Because the proportion of service workers across the state has increased slightly, the lack of growth in Boston’s low-wage service jobs could signal that service workers no longer live in the city. Finally, in terms of class of worker, there has been a slight increase in the percentage of workers living in Boston who work for nonprofit employers, mostly educational and health-care institutions in the city.
Despite new attention to the so-called gig economy, the percentage of Bostonians that report being self-employed in their primary job is small (7.7 percent) and has actually shrunk over the two periods.8 This suggests that while more workers may feel or be economically insecure, it is not because they do not have a formal employer. The decline of self-employment may instead reflect the city’s loss of construction workers, who are typically self-employed.
Comparing workers who live in Boston to those residing in the suburbs and beyond the Boston metro region, we see that Boston workers are much more likely to be employed in service occupations and industries as well as for nonprofit employers. This is not surprising given the concentration of nonprofit health-care and educational service industries and occupations in the city. Outside of the larger share of service workers (both in service occupations and in health-care services industry) and the lower share of blue-collar occupations and industries, workers in Boston and its suburbs have similar occupational and industrial composition. The areas outside the Boston metro region have a higher share of workers in pink-and blue-collar jobs and a considerably lower share of managers and professionals.
Earnings and Earnings Inequality
Overall, Massachusetts and the Boston metro region have experienced strong inflation-adjusted economic growth between 2005 and 2015, as measured in terms of state gross domestic product (GDP). Total Massachusetts GDP grew by 16.3 percent over this period, above the US average state growth rate of 13.3 percent. At 16.9 percent, the Boston metropolitan area saw an even higher GDP growth than the state as a whole and more than the 13.1 percent average increase in metro areas nationwide.9 Turning to earnings growth using ACS data, we find that total inflation-adjusted annual wages, salaries, and income from self-employment across the state grew by 10.3 percent from the 2005–2007 to the 2013–2015 period. Earnings of workers in Boston in 2013-2015, however, were almost 20 percent higher than in 2005–2007, compared to an 8.9 percent increase in Boston suburbs and a 10.1 percent increase in earning in the rest of the state. This suggests that all workers in the state have seen inflation-adjusted rise in earnings, but Boston workers’ earnings growth has been twice that of workers elsewhere in the state.
Of the state’s 3,266,000 workers, 314,515 (9.6 percent) live in Boston, while 49.2 percent live in Boston’s suburban area, with the remaining 41.2 percent outside the Boston metro region. Boston workers garnered 9.6 percent of all earnings in the state in the 2013–2015 period, matching their worker population share. However, suburban workers received 56 percent of all earnings while non-Boston metro areas had 34 percent. Not surprisingly then, workers living in Boston’s suburban areas had higher levels of earnings than workers living in Boston or outside the Boston metro region. On average, workers in Boston earned $60,500 annually, while those in the suburbs had an annual average of $69,200, considerably more than the non-Boston metro average of $50,300. Regression analysis indicates that after adjusting for age, race, gender, education level, nativity, industry, occupation, and weeks worked, Boston workers earned slightly more than workers in the suburbs and much higher than those outside the metro area.10 This means that workers in Boston actually have a slight wage premium over those in suburban areas, once controlling for their demographic and employment differences. So, earnings differences are largely explained by the composition of Boston’s workers compared to those in the suburbs.
And while average earnings grew over the two time periods, that growth was not shared equally among workers. Figure 1.1 depicts the earnings levels at the 20th, 50th (or median), and 80th percentile of earners11...