Summary Data Wrangling with JavaScript is hands-on guide that will teach you how to create a JavaScript-based data processing pipeline, handle common and exotic data, and master practical troubleshooting strategies.Purchase of the print book includes a free eBook in PDF, Kindle, and ePub formats from Manning Publications. About the Technology Why not handle your data analysis in JavaScript? Modern libraries and data handling techniques mean you can collect, clean, process, store, visualize, and present web application data while enjoying the efficiency of a single-language pipeline and data-centric web applications that stay in JavaScript end to end. About the Book Data Wrangling with JavaScript promotes JavaScript to the center of the data analysis stage! With this hands-on guide, you'll create a JavaScript-based data processing pipeline, handle common and exotic data, and master practical troubleshooting strategies. You'll also build interactive visualizations and deploy your apps to production. Each valuable chapter provides a new component for your reusable data wrangling toolkit. What's inside
Establishing a data pipeline
Acquisition, storage, and retrieval
Handling unusual data sets
Cleaning and preparing raw dataInteractive visualizations with D3
About the Reader Written for intermediate JavaScript developers. No data analysis experience required. About the Author Ashley Davis is a software developer, entrepreneur, author, and the creator of Data-Forge and Data-Forge Notebook, software for data transformation, analysis, and visualization in JavaScript. Table of Contents
Getting started: establishing your data pipeline
Getting started with Node.js
Acquisition, storage, and retrieval
Working with unusual data
Exploratory coding
Clean and prepare
Dealing with huge data files
Working with a mountain of data
Practical data analysis
Browser-based visualization
Server-side visualization
Live data
Advanced visualization with D3
Getting to production
Häufig gestellte Fragen
Wie kann ich mein Abo kündigen?
Gehe einfach zum Kontobereich in den Einstellungen und klicke auf „Abo kündigen“ – ganz einfach. Nachdem du gekündigt hast, bleibt deine Mitgliedschaft für den verbleibenden Abozeitraum, den du bereits bezahlt hast, aktiv. Mehr Informationen hier.
(Wie) Kann ich Bücher herunterladen?
Derzeit stehen all unsere auf Mobilgeräte reagierenden ePub-Bücher zum Download über die App zur Verfügung. Die meisten unserer PDFs stehen ebenfalls zum Download bereit; wir arbeiten daran, auch die übrigen PDFs zum Download anzubieten, bei denen dies aktuell noch nicht möglich ist. Weitere Informationen hier.
Welcher Unterschied besteht bei den Preisen zwischen den Aboplänen?
Mit beiden Aboplänen erhältst du vollen Zugang zur Bibliothek und allen Funktionen von Perlego. Die einzigen Unterschiede bestehen im Preis und dem Abozeitraum: Mit dem Jahresabo sparst du auf 12 Monate gerechnet im Vergleich zum Monatsabo rund 30 %.
Was ist Perlego?
Wir sind ein Online-Abodienst für Lehrbücher, bei dem du für weniger als den Preis eines einzelnen Buches pro Monat Zugang zu einer ganzen Online-Bibliothek erhältst. Mit über 1 Million Büchern zu über 1.000 verschiedenen Themen haben wir bestimmt alles, was du brauchst! Weitere Informationen hier.
Unterstützt Perlego Text-zu-Sprache?
Achte auf das Symbol zum Vorlesen in deinem nächsten Buch, um zu sehen, ob du es dir auch anhören kannst. Bei diesem Tool wird dir Text laut vorgelesen, wobei der Text beim Vorlesen auch grafisch hervorgehoben wird. Du kannst das Vorlesen jederzeit anhalten, beschleunigen und verlangsamen. Weitere Informationen hier.
Ist Data Wrangling with JavaScript als Online-PDF/ePub verfügbar?
Ja, du hast Zugang zu Data Wrangling with JavaScript von Ashley Davis im PDF- und/oder ePub-Format sowie zu anderen beliebten Büchern aus Informatique & Traitement des données. Aus unserem Katalog stehen dir über 1 Million Bücher zur Verfügung.
1 Getting started: establishing your data pipeline
This chapter covers
Understanding the what and why of data wrangling
Defining the difference between data wrangling and data analysis
Learning when it’s appropriate to use JavaScript for data analysis
Gathering the tools you need in your toolkit for JavaScript data wrangling
Walking through the data-wrangling process
Getting an overview of a real data pipeline
1.1 Why data wrangling?
Our modern world seems to revolve around data. You see it almost everywhere you look. If data can be collected, then it’s being collected, and sometimes you must try to make sense of it.
Analytics is an essential component of decision-making in business. How are users responding to your app or service? If you make a change to the way you do business, does it help or make things worse? These are the kinds of questions that businesses are asking of their data. Making better use of your data and getting useful answers can help put us ahead of the competition.
Data is also used by governments to make policies based on evidence, and with more and more open data becoming available, citizens also have a part to play in analyzing and understanding this data.
Data wrangling, the act of preparing your data for interrogation, is a skill that’s in demand and on the rise. Proficiency in data-related skills is becoming more and more prevalent and is needed by a wider variety of people. In this book you’ll work on your data-wrangling skills to help you support data-related activities.
These skills are also useful in your day-to-day development tasks. How is the performance of your app going? Where is the performance bottleneck? Which way is your bug count heading? These kinds of questions are interesting to us as developers, and they can also be answered through data.
1.2 What’s data wrangling?
Wikipedia describes data wrangling as the process of converting data, with the help of tools, from one form to another to allow convenient consumption of the data. This includes transformation, aggregation, visualization, and statistics. I’d say that data wrangling is the whole process of working with data to get it into and through your pipeline, whatever that may be, from data acquisition to your target audience, whoever they might be.
Many books only deal with data analysis, which Wikipedia describes as the process of working with and inspecting data to support decision-making. I view data analysis as a subset of the data-wrangling process. A data analyst might not care about databases, REST APIs, streaming data, real-time analysis, preparing code and data for use in production, and the like. For a data wrangler, these are often essential to the job.
A data analyst might spend most of the time analyzing data offline to produce reports and visualizations to aid decision-makers. A data wrangler also does these things, but they also likely have production concerns: for example, they might need their code to execute in a real-time system with automatic analysis and visualization of live data.
The data-wrangling puzzle can have many pieces. They fit together in many different and complex ways. First, you must acquire data. The data may contain any number of problems that you need to fix. You have many ways you can format and deliver the data to your target audience. In the middle somewhere, you must store the data in an efficient format. You might also have to accept streaming updates and process incoming data in real time.
Ultimately the process of data wrangling is about communication. You need to get your data into a shape that promotes clarity and understanding and enables fast decision-making. How you format and represent the data and the questions you need to ask of it will vary dramatically according to your situation and needs, yet these questions are critical to achieving an outcome.
Through data wrangling, you corral and cajole your data from one shape to another. At times, it will be an extremely messy process, especially when you don’t control the source. In certain situations, you’ll build ad hoc data processing code that will be run only once. This won’t be your best code. It doesn’t have to be because you may never use it again, and you shouldn’t put undue effort into code that you won’t reuse. For this code, you’ll expend only as much effort as necessary to prove that the output is reliable.
At other times, data wrangling, like any coding, can be an extremely disciplined process. You’ll have occasions when you understand the requirements well, and you’ll have patiently built a production-ready data processing pipeline. You’ll put great care and skill into this code because it will be invoked many thousands of times in a production environment. You may have used test-driven development, and it’s probably some of the most robust code you’ve ever written.
More than likely your data wrangling will be somewhere within the spectrum between ad hoc and disciplined. It’s likely that you’ll write a bit of throw-away code to transform your source data into something more usable. Then for other code that must run in production, you’ll use much more care.
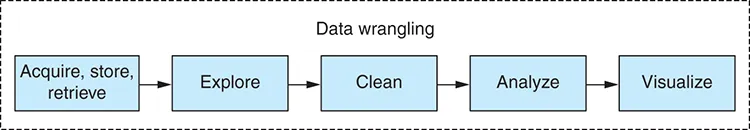
The process of data wrangling consists of multiple phases, as you can see in figure 1.1. This book divides the process into these phases as though they were distinct, but they’re rarely cleanly separated and don’t necessarily flow neatly one after the other. I separate them here to keep things simple and make things easier to explain. In the real world, it’s never this clean and well defined. The phases of data wrangling intersect and interact with each other and are often tangled up together. Through these phases you understand, analyze, reshape, and transform your data for delivery to your audience.
Figure 1.1 Separating data wrangling into phases
The main phases of data wrangling are data acquisition, exploration, cleanup, transformation, analysis, and finally reporting and visualization.
Data wrangling involves wrestling with many different issues. How can you filter or optimize data, so you can work with it more effectively? How can you improve your code to process the data more quickly? How do you work with your language to be more effective? How can you scale up and deal with larger data sets?
Throughout this book you’ll look at the process of data wrangling and each of its constituent phases. Along the way we’ll discuss many issues and how you should tackle them.
1.3 Why a book on JavaScript data wrangling?
JavaScript isn’t known for its data-wrangling chops. Normally you’re told to go to other languages to work with data. In the past I’ve used Python and Pandas when working with data. That’s what everyone says to use, right? Then why write this book?
Python and Pandas are good for data analysis. I won’t attempt to dispute that. They have the maturity and the established ecosystem.
Jupyter Notebook (formerly IPython Notebook) is a great environment for ...