The Informed Company
eBook - ePub

The Informed Company

How to Build Modern Agile Data Stacks that Drive Winning Insights

Dave Fowler, Matthew C. David

Buch teilen
  1. English
  2. ePUB (handyfreundlich)
  3. Über iOS und Android verfügbar
eBook - ePub

The Informed Company

How to Build Modern Agile Data Stacks that Drive Winning Insights

Dave Fowler, Matthew C. David

Angaben zum Buch
Buchvorschau
Inhaltsverzeichnis
Quellenangaben

Über dieses Buch

Learn how to manage a modern data stack and get the most out of data in your organization!

Thanks to the emergence of new technologies and the explosion of data in recent years, we need new practices for managing and getting value out of data. In the modern, data driven competitive landscape the "best guess" approach—reading blog posts here and there and patching together data practices without any real visibility—is no longer going to hack it. The Informed Company provides definitive direction on how best to leverage the modern data stack, including cloud computing, columnar storage, cloud ETL tools, and cloud BI tools. You'll learn how to work with Agile methods and set up processes that's right for your company to use your data as a key weapon for your success... You'll discover best practices for every stage, from querying production databases at a small startup all the way to setting up data marts for different business lines of an enterprise.

In their work at Chartio, authors Fowler and David have learned that most businesspeople are almost completely self-taught when it comes to data. If they are using resources, those resources are outdated, so they're missing out on the latest cloud technologies and advances in data analytics. This book will firm up your understanding of data and bring you into the present with knowledge around what works and what doesn't.

  • Discover the data stack strategies that are working for today's successful small, medium, and enterprise companies
  • Learn the different Agile stages of data organization, and the right one for your team
  • Learn how to maintain Data Lakes and Data Warehouses for effective, accessible data storage
  • Gain the knowledge you need to architect Data Warehouses and Data Marts
  • Understand your business's level of data sophistication and the steps you can take to get to "level up" your data

The Informed Company is the definitive data book for anyone who wants to work faster and more nimbly, armed with actionable decision-making data.

Häufig gestellte Fragen

Wie kann ich mein Abo kündigen?
Gehe einfach zum Kontobereich in den Einstellungen und klicke auf „Abo kündigen“ – ganz einfach. Nachdem du gekündigt hast, bleibt deine Mitgliedschaft für den verbleibenden Abozeitraum, den du bereits bezahlt hast, aktiv. Mehr Informationen hier.
(Wie) Kann ich Bücher herunterladen?
Derzeit stehen all unsere auf Mobilgeräte reagierenden ePub-Bücher zum Download über die App zur Verfügung. Die meisten unserer PDFs stehen ebenfalls zum Download bereit; wir arbeiten daran, auch die übrigen PDFs zum Download anzubieten, bei denen dies aktuell noch nicht möglich ist. Weitere Informationen hier.
Welcher Unterschied besteht bei den Preisen zwischen den Aboplänen?
Mit beiden Aboplänen erhältst du vollen Zugang zur Bibliothek und allen Funktionen von Perlego. Die einzigen Unterschiede bestehen im Preis und dem Abozeitraum: Mit dem Jahresabo sparst du auf 12 Monate gerechnet im Vergleich zum Monatsabo rund 30 %.
Was ist Perlego?
Wir sind ein Online-Abodienst für Lehrbücher, bei dem du für weniger als den Preis eines einzelnen Buches pro Monat Zugang zu einer ganzen Online-Bibliothek erhältst. Mit über 1 Million Büchern zu über 1.000 verschiedenen Themen haben wir bestimmt alles, was du brauchst! Weitere Informationen hier.
Unterstützt Perlego Text-zu-Sprache?
Achte auf das Symbol zum Vorlesen in deinem nächsten Buch, um zu sehen, ob du es dir auch anhören kannst. Bei diesem Tool wird dir Text laut vorgelesen, wobei der Text beim Vorlesen auch grafisch hervorgehoben wird. Du kannst das Vorlesen jederzeit anhalten, beschleunigen und verlangsamen. Weitere Informationen hier.
Ist The Informed Company als Online-PDF/ePub verfügbar?
Ja, du hast Zugang zu The Informed Company von Dave Fowler, Matthew C. David im PDF- und/oder ePub-Format sowie zu anderen beliebten Büchern aus Business & Meetings & Presentations. Aus unserem Katalog stehen dir über 1 Million Bücher zur Verfügung.

Information

Verlag
Wiley
Jahr
2021
ISBN
9781119748014

STAGE 1
SOURCE
aka Siloed Data

image

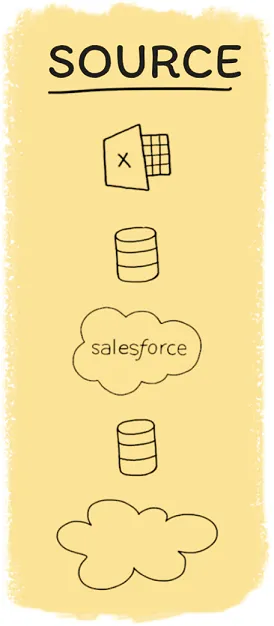
Source Stage Overview

Modern businesses, even modest sized ones, generate heaps of data that comes in several flavors—product information, customer information, app performance, marketing expenditures, and more. A new business can work with data from production databases, product APIs, and financials directly from their sources.
Over time, as sources accumulate more data, the number of data channels grows as well. It becomes even more challenging to manage data across separate sources.
This section is about helping you work with sources. We talk about what sources are and what we can do with them. From there, we survey the tools commonly used to connect and investigate sources; for each example, we offer quick but tested thoughts on how these tools can be used by your team. We complete our discussion on sources by encouraging best practices on how to work with data during the source stage. We advocate for source replicas and streamlined data intelligence tools.
This stage is ideal for new companies or teams with minimal data needs. It is inexpensive and relatively easy to tool, implement, and maintain. While it is exciting to build out a sophisticated data stack, it is not necessary before circumstances require it. Over-engineering is a costly mistake. However, the methods discussed in Chapters 1, 2, and 3 set the stage for your future data lake and data warehouse that arise as the scale and diversity of your source data proliferate.

Chapter One
Starting with Source Data

When starting from scratch, keep in mind the potential for the data to grow and the usability needs of users in the future. In the beginning, sources are their own islands separated from each other. Data streams remain in their own “silo.” When a data team is small, a collection of sources is easy to maintain and monitor. For example, to support new data teams, many data sources have their own built‐in dashboards and reporting capabilities (see Salesforce, Heap, and so on).
While single‐source data isn't all that powerful, it's not at all useless. Some everyday use cases of solutions built from single‐source data include:
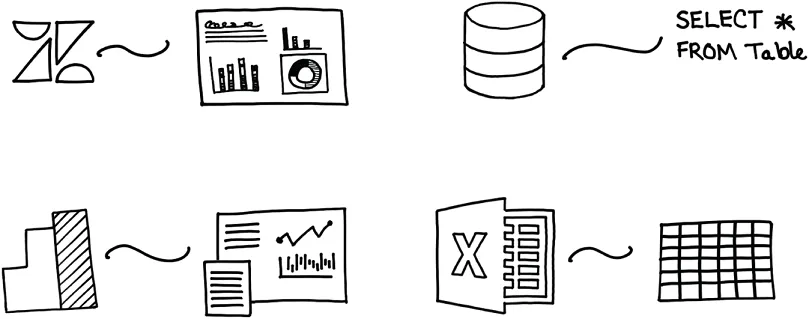
  • Database queries that generate customer acquisition metrics.
  • A dashboard that displays monthly sales featuring a downloadable spreadsheet.
  • A custom web application that allows searching of referral traffic.
Siloed reporting does not yield the powerful data insights that more sophisticated teams need, but this is often where teams must start. The analyst's role becomes that of an instructor to stakeholders—the analyst must understand sources and support business stakeholders who read and interact with this limited data. An analyst may pull together numbers from separate comma‐separated value files (CSVs) and run manual analysis in Excel or with basic SQL queries.
As we explore data sources, remember that analysts can do much more for their teams than work with business intelligence tools, Excel, and simple queries. In time, they can build abstractions on top of the data that make data accessible to other colleagues and self‐servable (more on this in Stages 2 and 3).

Common Options for Analyzing Source Data

Data ends up in many different places, but the methods to analyze them boil down to application dashboards, Excel spreadsheets, SQL IDEs, cloud dashboarding tools, or business intelligence (BI). We proceed to touch on several common tools used for interacting with sources, giving a short judgment on when and how to use them (Figure 1.1).
image
Figure 1.1 Various methods for data analysis for data sources.

Get to Know Data with Application Dashboards

Many modern software as a service (SaaS) applications come built with a set of fixed dashboards and visualizations to showcase the data they are capturing (Figure 1.2). These charts are highly tuned to specific use cases and can be quite informative—and maybe meet all data needs. Some, like Salesforce, even have a customizable chart and dashboard creator built in to support ad‐hoc querying. Many have custom query languages, too. These can go a long way, especially...

Inhaltsverzeichnis