
Extending Power BI with Python and R
Luca Zavarella, Francesca Lazzeri
- 558 Seiten
- English
- ePUB (handyfreundlich)
- Über iOS und Android verfügbar
Extending Power BI with Python and R
Luca Zavarella, Francesca Lazzeri
Über dieses Buch
Perform more advanced analysis and manipulation of your data beyond what Power BI can do to unlock valuable insights using Python and RKey Features• Get the most out of Python and R with Power BI by implementing non-trivial code• Leverage the toolset of Python and R chunks to inject scripts into your Power BI dashboards• Implement new techniques for ingesting, enriching, and visualizing data with Python and R in Power BIBook DescriptionPython and R allow you to extend Power BI capabilities to simplify ingestion and transformation activities, enhance dashboards, and highlight insights. With this book, you'll be able to make your artifacts far more interesting and rich in insights using analytical languages.You'll start by learning how to configure your Power BI environment to use your Python and R scripts. The book then explores data ingestion and data transformation extensions, and advances to focus on data augmentation and data visualization. You'll understand how to import data from external sources and transform them using complex algorithms. The book helps you implement personal data de-identification methods such as pseudonymization, anonymization, and masking in Power BI. You'll be able to call external APIs to enrich your data much more quickly using Python programming and R programming. Later, you'll learn advanced Python and R techniques to perform in-depth analysis and extract valuable information using statistics and machine learning. You'll also understand the main statistical features of datasets by plotting multiple visual graphs in the process of creating a machine learning model.By the end of this book, you'll be able to enrich your Power BI data models and visualizations using complex algorithms in Python and R.What you will learn• Discover best practices for using Python and R in Power BI products• Use Python and R to perform complex data manipulations in Power BI• Apply data anonymization and data pseudonymization in Power BI• Log data and load large datasets in Power BI using Python and R• Enrich your Power BI dashboards using external APIs and machine learning models• Extract insights from your data using linear optimization and other algorithms• Handle outliers and missing values for multivariate and time-series data• Create any visualization, as complex as you want, using R scriptsWho this book is forThis book is for business analysts, business intelligence professionals, and data scientists who already use Microsoft Power BI and want to add more value to their analysis using Python and R. Working knowledge of Power BI is required to make the most of this book. Basic knowledge of Python and R will also be helpful.
Häufig gestellte Fragen
Information
Section 1: Best Practices for Using R and Python in Power BI
- Chapter 1, Where and How to Use R and Python Scripts in Power BI
- Chapter 2, Configuring R with Power BI
- Chapter 3, Configuring Python with Power BI
Chapter 1: Where and How to Use R and Python Scripts in Power BI
- Injecting R or Python scripts into Power BI
- Using R and Python to interact with your data
- R and Python limitations on Power BI products
Technical requirements
Injecting R or Python scripts into Power BI
Data loading
- There are many connectors that allow you to do this, depending on the respective data sources, but you can also do it via scripts in Python and R. In fact, if you click on the Get data icon in the ribbon, not only the most commonly used connectors are shown, but you can select other ones from a more complete list by clicking on More...:
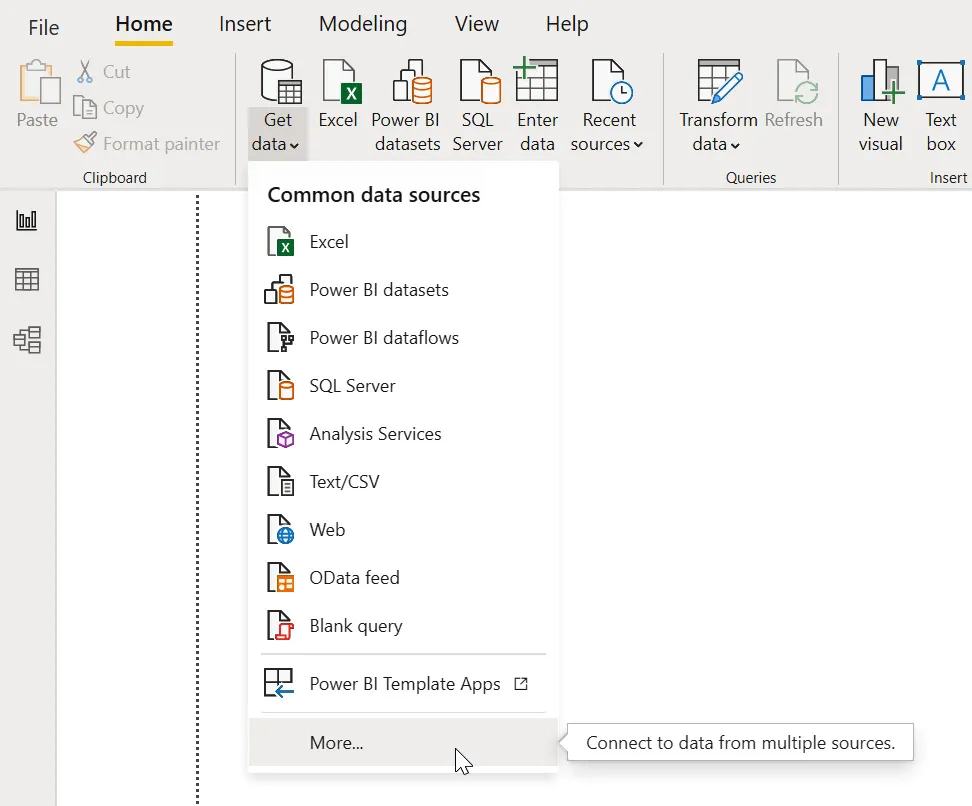 Figure 1.1 – Browse more connectors to load your data
 - In the new Get Data window that pops up, simply start typing the string script into the search text box, and immediately the two options for importing data via Python or R appear:
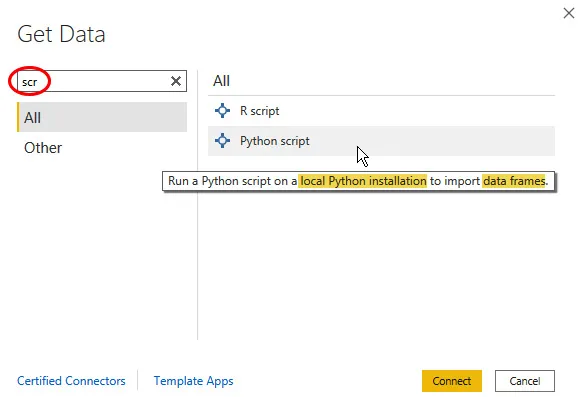 Figure 1.2 – Showing R script and Python script into the Get Data window
 - Reading the contents of the tooltip, obtained by hovering the mouse over the Python script option, two things should immediately jump out at you:a) A local installation of Python is required.b) What can be imported through Python is a data frame.The same two observations also apply when selecting R script. The only difference is that it is possible to import a pandas DataFrame when using Python (a DataFrame is a data structure provided by the pandas package), whereas R employs the two-dimensional array-like data structure called an R data frame, which is provided by default by the language.
- After clicking on the Python script option, a new window will be...