Experimental Design and Statistical Analysis for Pharmacology and the Biomedical Sciences
eBook - ePub

Experimental Design and Statistical Analysis for Pharmacology and the Biomedical Sciences

Paul J. Mitchell

Buch teilen
  1. English
  2. ePUB (handyfreundlich)
  3. Über iOS und Android verfügbar
eBook - ePub

Experimental Design and Statistical Analysis for Pharmacology and the Biomedical Sciences

Paul J. Mitchell

Angaben zum Buch
Buchvorschau
Inhaltsverzeichnis
Quellenangaben

Über dieses Buch

Experimental Design and Statistical Analysis for Pharmacology and the Biomedical Sciences

A practical guide to the use of basic principles of experimental design and statistical analysis in pharmacology

Experimental Design and Statistical Analysis for Pharmacology and the Biomedical Sciences provides clear instructions on applying statistical analysis techniques to pharmacological data. Written by an experimental pharmacologist with decades of experience teaching statistics and designing preclinical experiments, this reader-friendly volume explains the variety of statistical tests that researchers require to analyze data and draw correct conclusions.

Detailed, yet accessible, chapters explain how to determine the appropriate statistical tool for a particular type of data, run the statistical test, and analyze and interpret the results. By first introducing basic principles of experimental design and statistical analysis, the author then guides readers through descriptive and inferential statistics, analysis of variance, correlation and regression analysis, general linear modelling, and more. Lastly, throughout the textbook are numerous examples from molecular, cellular, in vitro, and in vivo pharmacology which highlight the importance of rigorous statistical analysis in real-world pharmacological and biomedical research.

This textbook also:

  • Describes the rigorous statistical approach needed for publication in scientific journals
  • Covers a wide range of statistical concepts and methods, such as standard normal distribution, data confidence intervals, and post hoc and a priori analysis
  • Discusses practical aspects of data collection, identification, and presentation
  • Features images of the output from common statistical packages, including GraphPad Prism, Invivo Stat, MiniTab and SPSS

Experimental Design and Statistical Analysis for Pharmacology and the Biomedical Sciences is an invaluable reference and guide for undergraduate and graduate students, post-doctoral researchers, and lecturers in pharmacology and allied subjects in the life sciences.

Häufig gestellte Fragen

Wie kann ich mein Abo kündigen?
Gehe einfach zum Kontobereich in den Einstellungen und klicke auf „Abo kündigen“ – ganz einfach. Nachdem du gekündigt hast, bleibt deine Mitgliedschaft für den verbleibenden Abozeitraum, den du bereits bezahlt hast, aktiv. Mehr Informationen hier.
(Wie) Kann ich Bücher herunterladen?
Derzeit stehen all unsere auf Mobilgeräte reagierenden ePub-Bücher zum Download über die App zur Verfügung. Die meisten unserer PDFs stehen ebenfalls zum Download bereit; wir arbeiten daran, auch die übrigen PDFs zum Download anzubieten, bei denen dies aktuell noch nicht möglich ist. Weitere Informationen hier.
Welcher Unterschied besteht bei den Preisen zwischen den Aboplänen?
Mit beiden Aboplänen erhältst du vollen Zugang zur Bibliothek und allen Funktionen von Perlego. Die einzigen Unterschiede bestehen im Preis und dem Abozeitraum: Mit dem Jahresabo sparst du auf 12 Monate gerechnet im Vergleich zum Monatsabo rund 30 %.
Was ist Perlego?
Wir sind ein Online-Abodienst für Lehrbücher, bei dem du für weniger als den Preis eines einzelnen Buches pro Monat Zugang zu einer ganzen Online-Bibliothek erhältst. Mit über 1 Million Büchern zu über 1.000 verschiedenen Themen haben wir bestimmt alles, was du brauchst! Weitere Informationen hier.
Unterstützt Perlego Text-zu-Sprache?
Achte auf das Symbol zum Vorlesen in deinem nächsten Buch, um zu sehen, ob du es dir auch anhören kannst. Bei diesem Tool wird dir Text laut vorgelesen, wobei der Text beim Vorlesen auch grafisch hervorgehoben wird. Du kannst das Vorlesen jederzeit anhalten, beschleunigen und verlangsamen. Weitere Informationen hier.
Ist Experimental Design and Statistical Analysis for Pharmacology and the Biomedical Sciences als Online-PDF/ePub verfügbar?
Ja, du hast Zugang zu Experimental Design and Statistical Analysis for Pharmacology and the Biomedical Sciences von Paul J. Mitchell im PDF- und/oder ePub-Format sowie zu anderen beliebten Büchern aus Medizin & Epidemiologie. Aus unserem Katalog stehen dir über 1 Million Bücher zur Verfügung.

Information

Jahr
2022
ISBN
9781119437666
Auflage
1
Thema
Medizin

1
Introduction

Experimental design: the important decision about statistical analysis

Whenever you make plans for your annual holiday, you do not just pack your suitcase willy‐nilly without first making plans about what you want to do, where you want to go, how you are going to get there, etc. For example, if your idea is to go trekking around the coast of Iceland, then you would look really stupid if, on arrival in Reykjavik, you opened your suitcase only to find beachwear and towels! Indeed, identifying what you want to do on holiday and where you intend to go determines what you need to take with you and what travel arrangements you need to make. In fact, what you do on holiday can be viewed as the final output of your holiday arrangements. The same can be said for the design of any well‐planned, robust, scientific experiment. The final output of your experiment, i.e. the communication of your results, whether it be a figure (scatter graph, bar chart, etc) or table, largely determines every single step in the preceding experimental design, including the strategy of your statistical analysis.
Figure 1.1 shows the final output of an experiment which examined the effect of pre‐treatment with mesulergine (an antagonist at 5‐HT2C receptors) on the ability of m‐chlorophenylpiperazine (mCPP; a 5‐HT2C receptor agonist) to reduce the locomotor activity of rats.
Schematic illustration of the effect of mesulergine on mCPP-induced hypolocomotion.
Figure 1.1 The effect of mesulergine on mCPP‐induced hypolocomotion. Vertical bars indicate mean locomotor activity counts ± Standard Error of the Mean. Saline‐pre‐treated animals were subcutaneously treated with either saline (open bar) or mCPP (vertical lines), while mesulergine‐pre‐treated subjects received either saline (stippled bar) or mCPP (solid bar). Two‐way ANOVA revealed main effects of pre‐treatment [F(1,28) = 74.799] and challenge treatment [F(1,28) = 110.999] and an interaction between pre‐ and challenge treatments [F(1,28) = 76.095], p < 0.001 in all cases. Post hoc analysis (Tukey) revealed that saline + mCPP combination‐treated animals exhibited significantly lower levels of activity than the other three treatment combination groups (***, p < 0.001 in all cases). For all other pairwise comparisons, p > 0.05. Data on file.
The bar chart contains four bars, each corresponding to the treatment combination administered to the subject animals, which are aligned along the x‐axis and whose height equates to the calculated arithmetic mean value of the corresponding locomotor activity as indicated on the y‐axis. Below the figure is the legend which describes the contents of the bar chart. The legend is divided into three sections. The first part is the figure number and the title, and usually these are in bold type. The second part is first half of the legend text in normal type and is a summary of the axis parameters arising from the experimental protocol, together with a summary of the Descriptive Statistics used to produce the bars and the key to differentiate each bar in the figure. The last part of the legend is a summary of the Inferential Statistics and includes, in this example, the data arising from both the ANOVA model and post hoc tests used to analyse the data (including an explanation of any indicators in the Figure, for example, the stars, used to identify significant differences between data sets); Screenshots of the statistical analysis are provided at the end of Chapter 17. This final output of your experiment is the last in a series of steps that comprise the complete experimental design process, and just as if you were planning your holiday to Iceland (the island, not the frozen food store!) or a sunny Mediterranean beach, it is easy to identify these steps in reverse order. Thus:
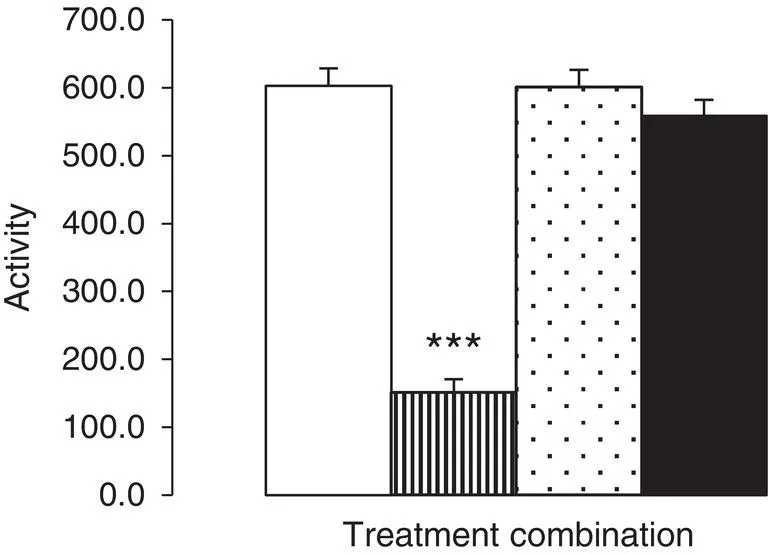
  • The step immediately prior to producing such a summary of experimental data is the Inferential Statistical tests employed to analyse the data. In the example provided here, this would be the two‐way ANOVA test followed by a suitable the post hoc test (here the Tukey test was used); why these tests were deemed appropriate will be explained later (see Chapter 17). The statistical test employed, however, is determined by the type and number of data sets produced by the experiment, but may include tests of data distribution and skewness, pairwise comparisons, other models of ANOVA, etc.
  • The step immediately prior to the Inferential Statistical analysis is the calculation of the Descriptive Statistics. These are the calculated summary values used to describe the data which are subsequently used to generate the data in the figure (e.g. bar height, etc.). Most experimental data are generally summarised by a measure of central tendency, such as the Mean (of which there are three types – but more about that later), together with the Standard Deviation or Standard Error of the Mean, Median (together with the range or semi‐quartile ranges), or Mode. However, note here that the measure of central tendency you report must be appropriate to the data your experiment has generated (see Chapters 5, 8, and 9).
  • The step prior to the statistical procedures is the input of your experimental data into your favourite statistical package. All statistical packages differ slightly from each other, but the most common method is to use a data spreadsheet similar to that seen with Microsoft Excel (see Figure 1.2).
    Snapshot of excel spreadsheet showing original rodent locomotor activity data examining the effect of mesulergine on mCPP-induced hypolocomotion.
    Figure 1.2 Excel spreadsheet showing original rodent locomotor activity data examining the effect of mesulergine on mCPP‐induced hypolocomotion (see Figure 1.1). The functionality of spreadsheets such as Microsoft Excel allows the calculation of simple Descriptive Statistics such as Mean, Standard Deviation, Standard Error of the Mean. Data on file.
  • Of course, you must generate your data before you are able to input such data into the spreadsheet and to achieve this you must decide on your experimental methodology – the process which generates a series of values which eventually allows you to draw conclusions about your experiment.
  • Before you decide on your methodology, however, you must have a working hypothesis which, in turn, is the result of your
  • experimental aims that address the
  • problem you have identified and is the raison d'etre of the whole experimental design process.
If we reverse these stages, then we have a list of events that summarise the experimental design process;

Experimental design process

  1. What is the problem?
  2. What is the aim?
  3. Hypothesis
  4. Experimental methodology
  5. Data collection
  6. Data input
  7. Descriptive Statistical data
  8. Inferential Statistical data
  9. Final output
Notice that the Descriptive and Inferential Statistical steps (steps 7 and 8) are integral to the overall experimental design process. It is absolutely...

Inhaltsverzeichnis