1
Neoliberalism, Inequality, and Development
Richard Peet
Who directs the development of economies? Who benefits most from each new form that development takes?
The question “Who directs?” is not easy to answer with capitalism. For in capitalism, millions of decisions by selfish actors collide in markets to produce an economy. The answer therefore appears to be “the market directs”—as though the market “itself” is a collective actor. Yet as Karl Polanyi (1944) demonstrated, markets are social constructions, with states playing a big part in making, shaping, and directing them. So the longer answer for capitalist economies is: markets as directed by states—states of many kinds, at different scales, and with the state “writ large” as governance and governmental institutions.
The question “Who benefits?” is a little easier to answer, once the notion that economies are important not just as producers of goods and services, but also jobs and incomes. Different types of economy produce different income distributions, some more egalitarian than others, with most being extremely skewed in favor of rich people. The main problem here is getting behind the ideological disguise of an economy. Because, if states indeed regulate the markets that organize economies, and governments are “freely elected” by virtually everyone, then potentially states can be instructed to regulate economies in the interests of all. And indeed democratic states must make this claim, even when they mainly are regulating economies in favor mainly of already-wealthy people. Economic development policy must, as a result, take an ideological form, often claiming to do the reverse of its real practice—for example, claiming that rewarding entrepreneurship creates more jobs for broad sections of the population, when what is really happening is capital and wealth are being accumulated by a few people, who do what they want with their money.
So these are complex, vital issues—who controls the economy, through what institutional and ideological means, in whose interest, to benefit whom? This chapter pretends only to provide a few analytical terms that can be used in answering such questions, along with some of the recent historical evidence on who benefits most from different types of economy.
POLICY REGIMES
States intervene to direct capitalist economies along trajectories that yield entirely different typical distributions of incomes among classes. We can use the term “policy regime” to describe typical sets of policies. The term “policy regime” indicates: a systematic approach to policy formation by a set of government or governance institutions, and their financial allies; dealing with a definable, limited range of issues; that prevails, as the dominant interventionary framework; over an historical period lasting at least several decades; and stretching over global space to include, in somewhat different regional forms in multiple societies. Policy regimes are lent coherence by an underlying political-economic interpretation of the causes of a set of related socioeconomic problems. This interpretation is not scientifi-cally neutral. Instead it represents the interests of certain elements of economic and political power, such as a fraction of capital, like finance capital, represented by a definable set of institutions, inhabited by a certain group of people, like investment bankers. Further, the ideologies that lend consistency, cohesion, and believability to policy regimes are constructed over long time periods by experts residing in geographic centers of ideological power, with ideas for new regimes thought up in prestigious, elite institutions. Change often comes from elite institutions that were previously peripheralized—as with the Chicago School of Economics in the U.S. Several policy regimes may co-exist in time, as past, present, and future versions of a given approach to solving a limited range of problems. Regimes may co-exist in space, as regionally variant approaches to somewhat differently experienced problems, with relations of dominance and subordination between the regional approaches—at any time one approach dominates— as with the Anglo-American neoliberal model. Indeed the co-existence in time, but separation in space, of more than one policy regime, makes the dominant regime dynamically effective—any effective policy regime contains elements of its alternatives and variants as co-opted, but potentially conflictive, elements—the “concern for poverty” in contemporary Anglo-American neoliberalism for instance. All this produces an overall, global policy regime that has been well described, in the case of neoliberalism, as a contradictory process, existing in historically and geographically contingent forms, produced during a period of institutional searching (Tickell and Peck 1995; Peck and Tickell 2002, 383; Peet 2007).
FROM KEYNESIANISM TO NEOLIBERALISM
Since World War II, the capitalist world has seen two main political-eco-nomic policy regimes: Keynesian Democracy, predominating between 1945 and 1973; and Neoliberal Democracy predominating between 1980 and the present; the years 1973–1980 represent a transitional period, when the two regimes contended for dominance, while the years since 2007 are another major crisis, that might alter Neoliberal Democracy—push it slightly toward Keynesianism or produce more of a state-banking sector synthesis.
The Keynesian policy regime was characterized by countercyclical macroeconomic management by an interventionist state committed to achieving full employment and high incomes for everyone. This regime responded to the Depression of the 1930s, a crisis that de-legitimized the theoretical rationality and the persuasive claims of the previous, long-lasting Liberal (free-trade) regime, by using state authority to stabilize accumulation and democratize economic benefits. Regional differences in theoretical-inter-pretative and political-economic tradition informed three main variants in the capitalist world: Social Democratic Keynesianism in Western European countries and their former settler colonies; Liberal Democratic Keynesian-ism in the U.S.; and Developmental State Keynesianism in Japan and many industrializing Third World countries (Chang and Rowthorn 1995; Kohli 2004), although we might add a fourth variant in the case of India, which combined socialism with Keynesianism into “one of the most heavily regulated economies in the world” (Nayer 1998).
The convention is that Keynesianism entered into crisis in the 1970s characterized by problems associated with stagflation—high rates of infla-tion coinciding with high rates of unemployment. But crises do not produce new policy regimes. Dominant actors do. So changes in policy regime might be seen as “interpretive moments”, when interpretations of crisis, reflecting contending interests, represented by institutions and leading individuals, clash in the court of economic and social opinion. To the victor goes the right to spoil the newly emerging regime. I return to this shortly.
The successor to Keynesianism, the Neoliberal policy regime, revives late nineteenth century, free trade Liberalism by reconstructing the state so that it serves business interests. Neoliberalism employs monetarist econom-ics under the conceptual belief that macroeconomic problems, like inflation and debt, derive from excessive government spending (fiscal deficits) on social programs. While regional variations in speed of adoption, and level of commitment, persist, the neoliberal regime responded positively to the globalization of economy, society, and culture of the late twentieth century. Indeed neoliberalism helped to organize the emergence of a particular kind of globalization that benefits a newly re-emergent, super-wealthy, financial-capitalist class, mainly living in the leading Western countries, especially the U.S., but operating transnationally in terms of investment activity.
GROWTH, INEQUALITY, AND POVERTY
If we divide the post-World War period into these two periods, the Keynes-ian-Social Democratic policy regime up to 1980 and the Neoliberal policy regime dominant since 1980, we can compare the social and economic results of the two policy regimes. The measure used by conventional economists to measure societal well-being is economic growth—let us, for a moment, accept this measure at face value (i.e., “growth is good”). Economic growth in the Organisation for Economic Co-operation and Development countries, the richest countries in the world, averaged 3.5% a year in the period 1961–1980, basically during Keynesianism, and 2.0% a year in 1981–1999, basically during neoliberalism. In developing countries excluding China (excluded because it was neither Keynesian nor neoliberal), the equivalent figures were 3.2% and 0.7% (Pollin 2003, 133). In other words, Keynesianism vastly out-performed neoliberalism in conventional (mainstream economics) terms. Now, looking at aspects of the economy more important to the well-being of the people than economic growth, let us compare the two periods in terms of inequality. Using data collected by the University of Texas Inequality Project on national structures of pay, Galbraith (2007, 587) finds “a worldwide pattern of declining inequality from 1971 until 1980, followed by a long and sharp period of increasing inequality from 1981 through the end of the century”, a tendency that he associates with changing “global macroeconomics”. In 1960 the 20% of the world’s people living in the richest countries had 30 times the income of the 20% of the world’s people living in the poorest countries; in 1973 the figure was 44 to 1; and in 1997 the ratio was 74 to 1 (UNDP 1999, 36–38). According to the World Bank (2008, 353), 1,056 million people living in the “high-income” countries and making up 16% of the world’s people receive $39.6 trillion in income, or 75.3% of the global income of $52.6 trillion, while 1,296 million people in the “low-income” countries, making up 19.6% of the world’s people, receive $0.75 trillion, or 1.4 % of global income. Putting this a little differently the “average person” living in the high-income countries gets 53 times as much as the “average person” living in the poor countries—or recalculating this in PPP terms (i.e., taking purchasing power into consideration), 20 times as much. National poverty rates in the low-income countries are in the range of 45% to 70% of the population, while the percentage of people living on less that $2 a day varies from 50% to 90%, depending on the country.
Yet geographic inequality only begins this sorry tale. Class, caste, ethnicity, region, and gender distribute incomes extremely unequally within countries. Of the 80% of income going to rich countries, 50% typically goes to the 20% of the people with the highest incomes, while the 20% of the people with the lowest incomes get 5% to 9%, again depending on the country. In the low-income countries, the richest 20% typically get 50% to 85% of national income, while the poorest 20% typically get 3% to 5% of the 1.4% of global income that these poor countries receive (World Bank 2008). The richest 2% of the world’s adult population now owns more than half of global household wealth; the bottom half of adults own barely 1% (UNDP 2007). The great, unmentioned fact about global income distribution is this: poverty results from inequality. National poverty increases as the world becomes a more unequal place. The poor are poverty stricken because the rich make so much. So, what has been happening to inequality under neoliberalism?
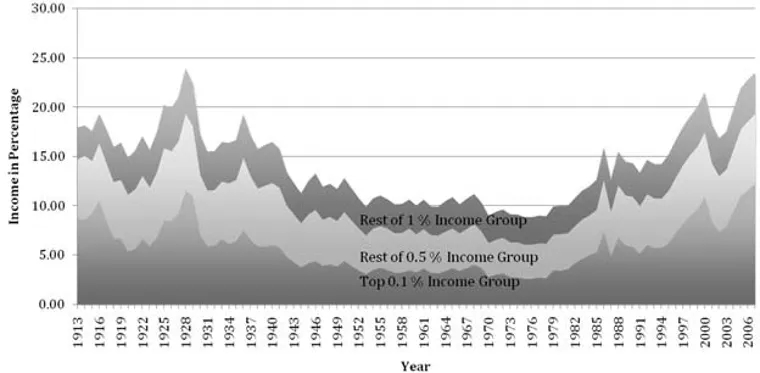
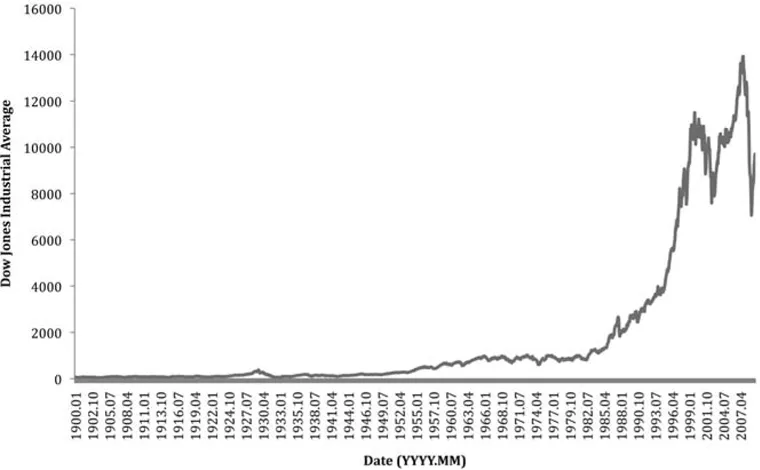
Take the case of the leading capitalist society, the U.S., set up as a neoliberal model copied by the rest of the world”. Between 1947 and 1973, under the Keynesian policy regime, every income category of people experienced real income growth, with the poorest families having the highest rate of growth of all. After 1973 average real income not only remained stagnant but reflected high income growth for the top 20% of families and a significant income decrease for the poorest 20%, so that almost half of all families received lower real incomes by the mid 1990s than they had in 1973 (Leone 1995). The key factor causing these secular changes in class incomes was an even greater divergence in the ownership of wealth, especially financial wealth—that is bank accounts, ownership of stocks and bonds, and life insurance and mutual fund savings. Particularly important is ownership of stocks and mutual fund shares. Despite “democrati-zation” (retirement savings invested in mutual funds, etc.), only 27% of U.S. families own stocks. While 78% of the richest families own stocks and mutual funds, 3% of the poorest families do so. The equalizing trends in wealth ownership of the entire, state interventionist period between the 1930s and the 1970s (New Deal, War Economy, Keynesianism), reversed sharply in the neoliberal 1980s, so that by 1989 the richest 1% of households owned almost half the total financial wealth of the U.S. (Wolf 1995), a concentration of ownership that has only become more extreme since (Harvey 2005, 16–17). Within this rich 1%, the super-rich—that one-thousandth of the population (145,000 people) making an average of $3 million a year—doubled its share of total national income between 1980 and 2002, to 7.4%, while the share earned by the bottom 90% fell (John-ston 2005, 1). All this produces the defining U-shape to the distribution of incomes over the last hundred years under liberalism, Keynesianism, and neoliberalism. Figure 1.1 shows the percentage of income going to the highest income 0.1%, 0.5%, and 1.0% of the U.S. population—it is based on tax returns, that tend to understate income going to the rich, if only because they hide it better and employ tax accountants more skilled than the bureaucratic accounts used by state bureaucracies. A major reason for this extremely skewed distribution of income is that neoliberalism is a way of running an economy that produces dramatic upsurges in the stock exchange, where the rich put their money to earn even more (Figure 1.2). And note that stocks are a relatively safe bet compared with neoliberal-ism’s other “irrational exuberances”, like derivatives. Liberalism and neoliberalism produce economic growth that almost exclusively benefits the super-rich. State intervention, even by the relatively non-interventionist, “liberal-democratic” U.S. state, reduces the proportion of income going to the super-rich and re-distributes income and state-subsidized services to the poorer sections of the population. Neoliberalism is development for the already-rich. This can be taken as indubitable fact.
Examining the data for 15 countries...