![]()
1 The Quality of Milk for Cheese Manufacture
T.P. Guinee and B. O’Brien
1.1 Introduction
World production of milk in 2008 is estimated at ~576 × 106 tonnes (ZMP, 2008), with India/Pakistan, the Americas and Europe being the major producing regions. The proportions of total milk produced by cow, water buffalo, goat, ewe, camel and other are ~84.0, 12.1, 2.0, 1.3, 0.2 and 0.2, respectively (International Dairy Federation – IDF, 2008). Cows’ milk is the major milk used for cheese manufacture; however, significant quantities of cheese are also made from goat, sheep and water buffalo milks in some European Union (EU) countries, such as France, Italy and Spain.
Based on an estimated yield of 1 kg cheese 10 kg−1 milk, the percentage of total milk used for cheese is ~25%, but varies widely from ~70–90% in some European countries (Italy, France, Denmark and Germany) to ~0.5% in China. While cheese-like products are produced in most parts of the world, the principal cheese-producing regions are Europe, North America and Oceania. Cheese production has increased consistently over the last two decades at an annual average rate of ~1.5%. As discussed in Chapter 8, this may be attributed to a number of factors including increases in global population and per capita income, globalisation of eating trends/habits, changing lifestyles, growth in use of cheese as an ingredient in the food service (in pizza-type dishes, cheese burgers and salad dishes) and industrial sectors (cordon bleu entrees, co-extruded products with cheese and gratins).
The increase in consumption has been paralleled by a greater emphasis on improved quality and consistency with respect to the levels of particular nutrients (fat, protein, calcium -Ca2+ and sodium -Na+), physical properties (texture and cooking attributes), sensory characteristics and processability (size reduction attributes, such as shredability; ability to yield processed cheeses or other cheese products when subjected to secondary processing). Consequently, this has necessitated an increase in the quality and consistency of all inputs (milk composition/quality, enzyme activity/purity, starter cultures characteristics, for example, acid productivity, phage resistance, autolytic properties and flavour-imparting characteristics) and standardisation of the manufacturing process (cf. Chapter 8). In an overall context, milk quality for cheese manufacture may be defined as its suitability for conversion into cheese and deliver cheese of the desired quality and yield. The current chapter examines milk quality for cheese manufacture and the factors affecting it, together with broad-based strategies for improving quality and consistency.
1.2 Overview of milk composition
Milk consists of protein (caseins and whey proteins), lipid, lactose, minerals (soluble and insoluble), minor components (enzymes, free amino acids, peptides) and water (Table 1.1).
The casein fraction coexists with the insoluble minerals as a calcium phosphate–casein complex. The water and its soluble constituents (lactose, native whey proteins, some minerals, citric acid and minor components) are referred to as serum. During cheese manufacture, the milk is subjected to a partial dehydration, involving controlled expulsion of serum and concentration of fat, caseins (and in some cases denatured, aggregated whey proteins) and some of the minerals. The methods engaged to affect the dehydration include limited destabilisation and aggregation of the calcium phosphate casein in the form of a gel network which
Table 1.1 Compositional and gelation characteristics of cows’ milks.
Source: Compiled from O’Brien et al. (1999b–d), Mehra et al. (1999) and Hickey et al. (2006b) for manufacturing milks.
| Gross composition | | |
| Dry matter (g 100 g−1) | 12.04 | 11.52–12.44 |
| Fat (g 100 g−1) | 3.55 | 3.24–3.90 |
| Lactose (g 100 g−1) | 4.42 | 4.21–4.56 |
| Total protein (g 100 g−1 ) | 3.25 | 2.99–3.71 |
| True protein (g 100 g−1 ) | 3.06 | 2.77–3.47 |
| Casein (g 100 g−1) | 2.51 | 2.29–2.93 |
| Whey protein (g 100 g−1) | 0.54 | 0.48–0.64 |
| Non-protein nitrogen (N) (g 100 g−1 N) | 5.33 | 4.79–6.16 |
| Urea (mg 100 g−1) | 27.60 | 22.00–37.50 |
| Ash (g 100 g−1) | 0.74 | 0.71–0.77 |
| Calcium (mg 100 mL−1) | 118 | 108–137 |
| Iron (mg 100 mL−1) | 976 | 460–1490 |
| Magnesium (mg 100 mL−1) | 107 | 96–117 |
| Chloride (mg 100 mL−1) | 100 | 95–116 |
| Vitamins/vitamin components | | |
| β-Carotene (μg g−1 fat) | 3.18 | 0.48–8.37 |
| Thiamine (μg mL−1) | 0.18 | 0.09–0.35 |
| Riboflavin (μg mL−1) | 0.88 | 0.19–1.85 |
| Vitamin A (μg g−1 fat) | 9.41 | 2.18–27.85 |
| Vitamin E (μg g−1 fat) | 25.56 | 6.84–42.15 |
| Iodine (I) (μg mL−1) | 0.28 | 0.20–0.51 |
| Cobalt (Co) (μg mL−1) | 0.96 | 0.44–1.70 |
| Gelation propertiesa | | |
| RCT (min) | 6.15 | 4.50–7.44 |
| A30 (mm) | 46.80 | 43.00–51.38 |
| 1/k20 (mm−1) | 0.23 | 0.3–0.19 |
| Other components | | |
| Total free fatty acids (mg kg−1 fat) | 3769 | 2629–5108 |
encloses the fat and serum via specific enzymatic hydrolysis of the casein, acidification (by fermentation of milk lactose to lactic acid by added bacterial cultures), elevated temperature and various mechanical operations as discussed in Chapter 8. Amongst others, the degrees of casein aggregation and dehydration are critical parameters controlling the properties and quality of the final cheese.
Although manufacturing procedures for most cheese types are very defined (at least in large modern cheesemaking facilities) in terms of technology applied and the type and levels of operations imposed on the milk (cf. Chapter 8), variations in cheese quality do occur. Seasonal variation in the composition and quality of milk are considered to be crucial factors contributing to the inconsistency in quality. Consequently, an overview of milk composition in terms of its relevance to cheese manufacture is presented below. The main focus of this chapter is on cows’ milk, which accounts for an estimated 95% of total milk used in cheese manufacture; the characteristics of other milks are discussed elsewhere (Anifantakis, 1986; Juárez, 1986; Remeuf & Lenoir, 1986; Muir et al., 1993a,b; Garcia-Ruiz et al., 2000; Bramanti et al., 2003; Huppertz et al., 2006; Kuchtik et al., 2008; Caravaca et al., 2009).
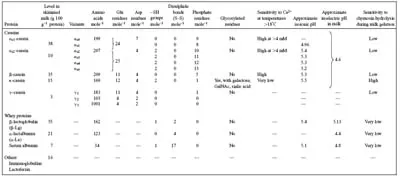
1.2.1 Casein
The nitrogenous fraction of cows’ milk typically consists of casein, whey protein and non-protein nitrogen (urea, proteose-peptones, peptides) at levels of ~78, 18 and 4 g 100 g−1, respectively, of total nitrogen (Table 1.1).
Casein, which is typically present at a level of 2.5 g 100 g−1 in cows’ milk, is the main structural protein of both rennet- and acid-induced milk gels (Table 1.1). The casein is heterogeneous, comprising four main types: αs1, αs2, β and κ, which represent ~38, 10, 35 and 15 g 100 g−1 of the total casein, respectively (Fox & McSweeney, 1998; Fox, 2003; Swaisgood, 2003). Model studies in dilute dispersions indicate that the individual caseins vary in the content and distribution of phosphate (Table 1.2); the respective number of (serine) phosphate residues per mole of casein are ~8, 10–13, 5 and 1 for αs1-, αs2- β- and κ-caseins, respectively. The serine phosphates bind calcium and calcium phosphate, and consequently, different caseins have different calcium-binding properties. Generally, αs1-, αs2- and β-caseins bind calcium strongly and precipitate at relatively low calcium concentrations (~0.005–0.1 M CaCl2 solutions), inclusive of the calcium level in milk (30 mM); in contrast κ-casein is not sensitive to these calcium concentrations and can, in fact, stabilise up to 10 times its mass of the calcium-sensitive caseins.
Casein in milk exists in the form of spherical-shaped colloid particles (~40–300 nm diameter), known as casein micelles (Fox & Brodkorb, 2008; McMahon & Oommen, 2008). Different models have been proposed for the structure of the casein micelle on the basis of the location of individual caseins (in response to their calcium sensitivity) and the calcium phosphate. These include:
- sub-micelle model (Schmidt, 1982), in which sub-micelles are ‘cemented’ together by colloidal calcium phosphate (CCP) and κ-casein-rich sub-micelles are mainly concentrated at the surface of the micelle; the hydrophilic C-terminal region of the κ-casein orient into the serum as a highly hydrated ‘hairy layer’ that is in a state of constant flux and confers stability to the micelle by steric repulsion;
- dual bonding model (Horne, 1998), in which the interior of the micelle is composed of αs- and β-caseins which form a lattice through interactions between hydrophobic regions (hydrophobic-induced) and between hydrophilic regions containing phosphoserine clusters (that attach to CCP clusters), while κ-casein molecules located at the surface interact hydrophobically with the other caseins (αs- or β-) and orient their highly hydrophilic regions (hairs) into the serum;
- tangled, cross-linked web model (Holt & Horne, 1996), comprising a ‘tangled’ mass of rheomorphic casein chains cross-linked by calcium phosphate nanoclusters, similar in casein composition throughout but with the chains becoming more diffuse at the micelle periphery (on moving outwards from the dense centre); and
- interlocked lattice model (McMahon & Oomen, 2008), featuring a system of interlocking sites composed of anchoring calcium phosphate nanoclusters (several hundred per micelle), which bind the phosphoserine domains of αs- and β-caseins; the hydrophobic ends of these caseins orientate away from the calcium phosphate nanocluster and interact hydrophobically with other α- and β-caseins, while κ-casein is predominantly surface located because of its lack of phosphoserine domains (to bind to the calcium phosphate nanoclusters) and its highly charged C-terminal regions (which prevents strong electrostatic interactions).
In all of the above models, the arrangement of casein within the micelle is such that the interior is mainly occupied by the calcium-sensitive caseins (αs- and β- and κ-casein is principally located at the surface, with its hydrophilic C-terminal region (caseinomacropeptide) oriented outwards toward the serum phase in the form of protruding negatively charged hairs, which create an ...