Tramline Trading
A practical guide to swing trading with tramlines, Elliott Waves and Fibonacci levels
John Burford
- English
- ePUB (apto para móviles)
- Disponible en iOS y Android
Tramline Trading
A practical guide to swing trading with tramlines, Elliott Waves and Fibonacci levels
John Burford
Información del libro
A straightforward, winning trading methodThere are certain universal chart patterns that are traced out time and time again by markets - these patterns have stood the test of time and can be instantly recognised by a skilled trader. When you learn how to spot these patterns and use them to forecast market action you have the basis of a winning trading method. Tramline Trading is a complete practical guide that shows you precisely how to do this.The Tramline Trading Method described here is a simple and complete system which combines Fibonacci levels, basic Elliott Wave Theory and John Burford's original tramline concepts. It is based on a small number of highly reliable patterns and can be put to use in any market. Every detail of how to put the method into practice is revealed, including how to spot developing patterns for high-probability, low-risk trades, where to place entry orders and stop losses, and the five best setups to look out for. Full colour chart illustrations are used throughout.As well as describing the method in full detail, John Burford also provides day-by-day trading diaries for four-month trading campaigns in gold and the Dow. These invaluable diaries show the mind of the trader as he surveys real-time market action and provide vital insight into how the trading method is used in real trading.If you are looking for a proven trading method that is reliable and easy to execute then Tramline Trading will put you on the right track. It is the essential new guide to a winning trading approach.
Preguntas frecuentes
Información
Part 1: The Tramline Trading Method
Chapter 1: My Charting Methods
- Support and resistance
- Trendlines
- My favourite chart patterns
- Momentum
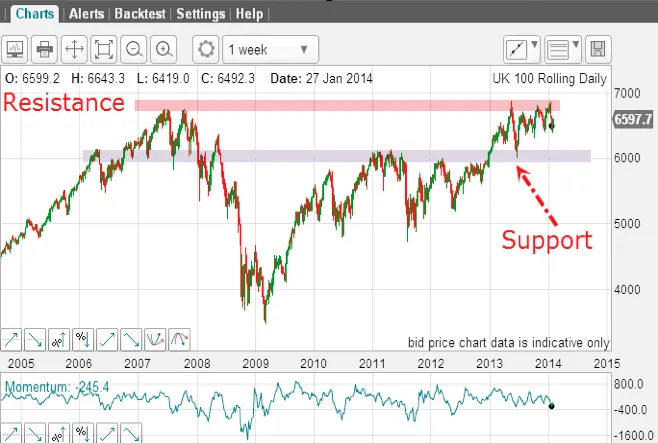
1.1 Support and resistance
- horizontal support/resistance levels in congestion zones
- trendlines (sloping lines of support/resistance)
- Fibonacci retraces
- chart support/resistance
1. Horizontal support/resistance levels
Figure 1.1.1
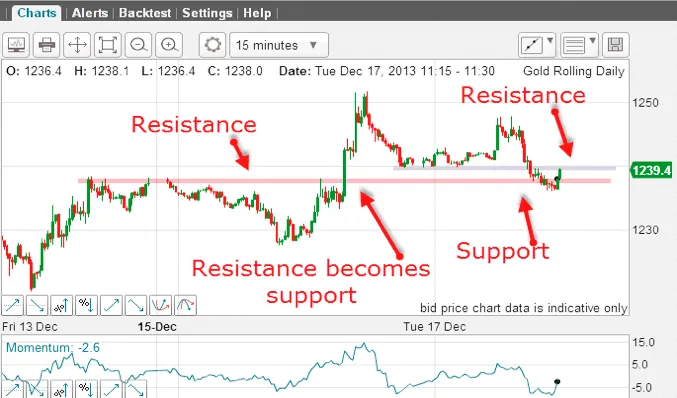
Figure 1.1.2
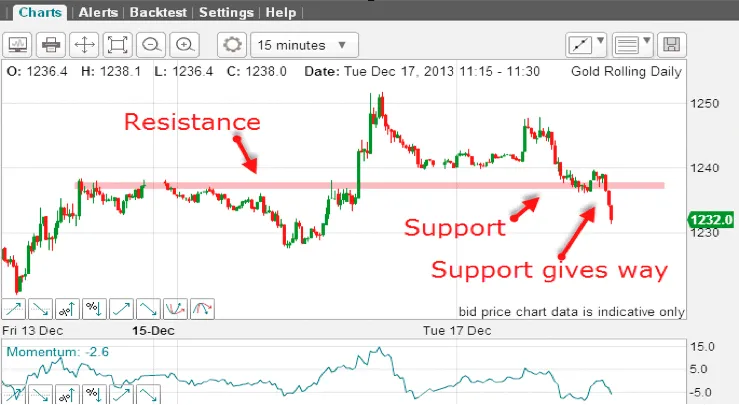
Figure 1.1.3