
Marketing Analytics
A Practical Guide to Improving Consumer Insights Using Data Techniques
Mike Grigsby
- English
- ePUB (apto para móviles)
- Disponible en iOS y Android
Marketing Analytics
A Practical Guide to Improving Consumer Insights Using Data Techniques
Mike Grigsby
Información del libro
Who is most likely to buy and what is the best way to target them? How can businesses improve strategy without identifying the key influencing factors? The second edition of Marketing Analytics enables marketers and business analysts to leverage predictive techniques to measure and improve marketing performance. By exploring real-world marketing challenges, it provides clear, jargon-free explanations on how to apply different analytical models for each purpose. From targeted list creation and data segmentation, to testing campaign effectiveness, pricing structures and forecasting demand, this book offers a welcome handbook on how statistics, consumer analytics and modelling can be put to optimal use. The fully revised second edition of Marketing Analytics includes three new chapters on big data analytics, insights and panel regression, including how to collect, separate and analyze big data. All of the advanced tools and techniques for predictive analytics have been updated, translating models such as tobit analysis for customer lifetime value into everyday use. Whether an experienced practitioner or having no prior knowledge, methodologies are simplified to ensure the more complex aspects of data and analytics are fully accessible for any level of application. Complete with downloadable data sets and test bank resources, this book supplies a concrete foundation to optimize marketing analytics for day-to-day business advantage.
Preguntas frecuentes
Información
PART ONE
Overview
01
A brief statistics review
Measures of central tendency
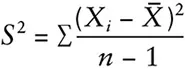
Measures of dispersion
| X | X-mean | Squared | |
2 | –23 | 529.3 | |
5 | –20 | 400.3 | |
8 | –17 | 289.2 | |
10.9 | –14.1 | 199.3 | |
13.9 | –11.1 | 123.6 | |
16.9 | –8.1 | 65.9 | |
19.9 | –5.1 | 26.2 | |
22.9 | –2.1 | 4.5 | |
25.9 | 0.9 | 0.8 | |
28.9 | 3.9 | 15.1 | |
31.9 | 6.9 | 47.4 | |
33 | 8 | 63.9 | |
34 | 9 | 80.9 | |
35 | 10 | 99.9 | |
36 | 11 | 120.9 | |
39 | 14 | 195.8 | |
42 | 17 | 288.8 | |
45 | 20 | 399.7 | |
Mean = 25.0 | Sum = 2,951.5 | ||
Count = 18 | Variance = 173.6 |