Who is most likely to buy and what is the best way to target them? How can businesses improve strategy without identifying the key influencing factors? The second edition of Marketing Analytics enables marketers and business analysts to leverage predictive techniques to measure and improve marketing performance. By exploring real-world marketing challenges, it provides clear, jargon-free explanations on how to apply different analytical models for each purpose. From targeted list creation and data segmentation, to testing campaign effectiveness, pricing structures and forecasting demand, this book offers a welcome handbook on how statistics, consumer analytics and modelling can be put to optimal use. The fully revised second edition of Marketing Analytics includes three new chapters on big data analytics, insights and panel regression, including how to collect, separate and analyze big data. All of the advanced tools and techniques for predictive analytics have been updated, translating models such as tobit analysis for customer lifetime value into everyday use. Whether an experienced practitioner or having no prior knowledge, methodologies are simplified to ensure the more complex aspects of data and analytics are fully accessible for any level of application. Complete with downloadable data sets and test bank resources, this book supplies a concrete foundation to optimize marketing analytics for day-to-day business advantage.
eBook - ePub
Marketing Analytics
A Practical Guide to Improving Consumer Insights Using Data Techniques
- English
- ePUB (mobile friendly)
- Available on iOS & Android
eBook - ePub
Marketing Analytics
A Practical Guide to Improving Consumer Insights Using Data Techniques
About this book
Trusted by 375,005 students
Access to over 1 million titles for a fair monthly price.
Study more efficiently using our study tools.
Information
PART ONE
Overview
How can marketing analytics help you?
01
A brief statistics review
Measures of central tendency 9
Measures of dispersion 11
The normal distribution 14
Confidence intervals 15
Relations among two variables: covariance and correlation 16
Probability and the sampling distribution 18
Conclusion 18
Checklist: You’ll be the smartest person in the room if you … 19
You knew we had to do this, have a general review of basic statistics. I promise, it’ll be mostly conceptual, a gentle reminder of what we learned in Introductory Statistics. Also note the definition boxes helping to describe key terms, point out jargon, etc.
Measures of central tendency
First we’ll deal with simple descriptive statistics, confined to one variable. We’ll start with measures of central tendency.
Measures of central tendency include the mean, median and mode.
Mode: the number that appears most often.
Average is the most representative number. Of course it doesn’t help this argument that Excel uses =AVERAGE() as the function to calculate the mean instead of =MEAN(). I’ve tried asking Bill about it but he’s not returned my calls, so far.
Measures of dispersion
Measures of central tendency alone do not adequately describe the variable (a variable is a thing that varies, like home sales prices). The other dimension of a variable is dispersion, or spread.
There are three measures of dispersion: range, variance and standard deviation.
Range: a measure of dispersion or spread, calculated as the maximum value less the minimum value.
Range is easy. It’s simply the minimum (smallest value) observation subtracted from the maximum (largest value). It’s not particularly useful, especially in a marketing context.
Variance is another measure of dispersion or spread.
Variance: a measure of spread, calculated as the summed square of each observation less the mean, divided by the count of observations less one.
Conceptually it takes each observation and subtracts the mean of all the observations from it, then squares each observation and adds up the squares. That quantity is divided by n–1, the total number of observations, less one. The formula is below. Note this is the sample formula, not the formula for the population.
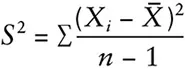
(Note that X-bar is the symbol for sample mean, while µ would be the symbol to use for population mean; s would be the symbol to use for sample standard deviation and σ would be the symbol to use for population standard deviation.)
Now, what does variance tell us? Unfortunately, not much. It says that (from Table 1.1) this variable of 18 observations has a mean of 25 and a variance, or spread, of 173.6. But variance gets us to the standard deviation, which DOES mean something.
Table 1.1 Variance
| X | X-mean | Squared | |
2 | –23 | 529.3 | |
5 | –20 | 400.3 | |
8 | –17 | 289.2 | |
10.9 | –14.1 | 199.3 | |
13.9 | –11.1 | 123.6 | |
16.9 | –8.1 | 65.9 | |
19.9 | –5.1 | 26.2 | |
22.9 | –2.1 | 4.5 | |
25.9 | 0.9 | 0.8 | |
28.9 | 3.9 | 15.1 | |
31.9 | 6.9 | 47.4 | |
33 | 8 | 63.9 | |
34 | 9 | 80.9 | |
35 | 10 | 99.9 | |
36 | 11 | 120.9 | |
39 | 14 | 195.8 | |
42 | 17 | 288.8 | |
45 | 20 | 399.7 | |
Mean = 25.0 | Sum = 2,951.5 | ||
Count = 18 | Variance = 173.6 |
Standard deviation: the square root of variance.
Standard deviation is calculated by taking the square root of variance. In this case the square root of 173.6 is 13.17. Now, what does 13.17 mean? It describes spread or dispersion in a way that removes the scale of the variable. That is, there are known qualities of a standard deviation. In a fairly normal distribution dispersion is spread around the mean (which equals the mode which equals the median). That is, there is a symmetrical spread around the mean of 25. In this case the spread is 25 +/– 13.17. That means that, in general, one standard deviation (+/– 13.17) from the mean will contain 68% of...
Table of contents
- Cover
- Title Page
- Copyright
- Contents
- List of Figures
- Foreword to the first edition
- Foreword to the second edition
- Preface
- Introduction to marketing analytics
- PART ONE Overview – how can marketing analytics help you?
- PART TWO Dependent variable techniques
- PART THREE Inter-relationship techniques
- PART FOUR More important topics for everyday marketing
- PART FIVE Conclusion
- Glossary
- Bibliography and further reading
- Index
- Backcover
Frequently asked questions
Yes, you can cancel anytime from the Subscription tab in your account settings on the Perlego website. Your subscription will stay active until the end of your current billing period. Learn how to cancel your subscription
No, books cannot be downloaded as external files, such as PDFs, for use outside of Perlego. However, you can download books within the Perlego app for offline reading on mobile or tablet. Learn how to download books offline
Perlego offers two plans: Essential and Complete
- Essential is ideal for learners and professionals who enjoy exploring a wide range of subjects. Access the Essential Library with 800,000+ trusted titles and best-sellers across business, personal growth, and the humanities. Includes unlimited reading time and Standard Read Aloud voice.
- Complete: Perfect for advanced learners and researchers needing full, unrestricted access. Unlock 1.4M+ books across hundreds of subjects, including academic and specialized titles. The Complete Plan also includes advanced features like Premium Read Aloud and Research Assistant.
We are an online textbook subscription service, where you can get access to an entire online library for less than the price of a single book per month. With over 1 million books across 990+ topics, we’ve got you covered! Learn about our mission
Look out for the read-aloud symbol on your next book to see if you can listen to it. The read-aloud tool reads text aloud for you, highlighting the text as it is being read. You can pause it, speed it up and slow it down. Learn more about Read Aloud
Yes! You can use the Perlego app on both iOS and Android devices to read anytime, anywhere — even offline. Perfect for commutes or when you’re on the go.
Please note we cannot support devices running on iOS 13 and Android 7 or earlier. Learn more about using the app
Please note we cannot support devices running on iOS 13 and Android 7 or earlier. Learn more about using the app
Yes, you can access Marketing Analytics by Mike Grigsby in PDF and/or ePUB format, as well as other popular books in Business & Consumer Behaviour. We have over one million books available in our catalogue for you to explore.