Be prepared for exam day with Barron's. Trusted content from AP experts! Barron's AP Q&A Statistics features 600 questions with answer explanations designed to sharpen your critical thinking skills, provide practice for all AP question types, and maximize understanding of the concepts covered on the AP exam. Why Study with AP Q&A?
Each practice question follows the AP Statistics curriculum and includes Exploratory Analysis, Collecting and Producing Data, Probability, and Statistical Inference
All content is specifically created to provide practice for frequently tested topics on the AP Statistics exam
Answers include comprehensive explanations-- you won't just learn why an answer is correct, you'll learn why the other choices are incorrect
Check out Barron's AP Statistics Premium for even more review, full-length practice tests, and access to Barron's Online Learning Hub for a timed test option and automated scoring.
Preguntas frecuentes
¿Cómo cancelo mi suscripción?
Simplemente, dirígete a la sección ajustes de la cuenta y haz clic en «Cancelar suscripción». Así de sencillo. Después de cancelar tu suscripción, esta permanecerá activa el tiempo restante que hayas pagado. Obtén más información aquí.
¿Cómo descargo los libros?
Por el momento, todos nuestros libros ePub adaptables a dispositivos móviles se pueden descargar a través de la aplicación. La mayor parte de nuestros PDF también se puede descargar y ya estamos trabajando para que el resto también sea descargable. Obtén más información aquí.
¿En qué se diferencian los planes de precios?
Ambos planes te permiten acceder por completo a la biblioteca y a todas las funciones de Perlego. Las únicas diferencias son el precio y el período de suscripción: con el plan anual ahorrarás en torno a un 30 % en comparación con 12 meses de un plan mensual.
¿Qué es Perlego?
Somos un servicio de suscripción de libros de texto en línea que te permite acceder a toda una biblioteca en línea por menos de lo que cuesta un libro al mes. Con más de un millón de libros sobre más de 1000 categorías, ¡tenemos todo lo que necesitas! Obtén más información aquí.
¿Perlego ofrece la función de texto a voz?
Busca el símbolo de lectura en voz alta en tu próximo libro para ver si puedes escucharlo. La herramienta de lectura en voz alta lee el texto en voz alta por ti, resaltando el texto a medida que se lee. Puedes pausarla, acelerarla y ralentizarla. Obtén más información aquí.
¿Es AP Q&A Statistics:With 600 Questions and Answers un PDF/ePUB en línea?
Sí, puedes acceder a AP Q&A Statistics:With 600 Questions and Answers de Martin Sternstein en formato PDF o ePUB, así como a otros libros populares de Study Aids y Advanced Placement. Tenemos más de un millón de libros disponibles en nuestro catálogo para que explores.
1.One element in the dotplot above is labeled X. Which of the statements below is true?
(A) X has the smallest z-score, in absolute value, of any element in the set.
(B) X has the largest z-score, in absolute value, of any element in the set.
(C) X has the smallest value of any element in the set.
(D) A boxplot will plot X as an isolated point.
(E) A back-to-back stemplot will show two symmetric clusters.
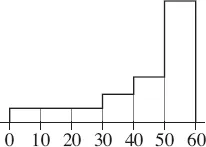
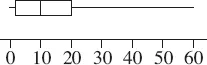
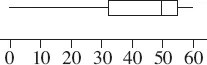
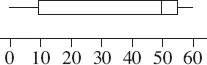
2.The histogram shown above might correspond to which of the boxplots below?
(A)
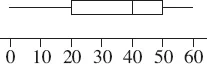
(B)
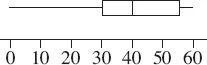
(C)
(D)
(E)
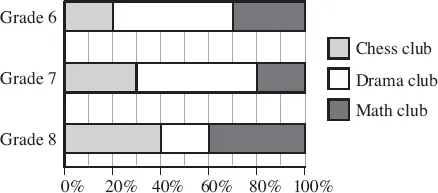
3.All students at a private middle school are required to sign up for one of the three clubs: chess, drama, or math. The graph below shows the distribution of participation by grade level.
Which of the following statements is incorrect?
(A) 30 percent of the 6th graders joined the math club.
(B) The number of 8th graders who joined the chess club is the same as the number of 8th graders who joined the math club.
(C) The number of 6th graders who joined the drama club is the same as the number of 7th graders who joined the drama club.
(D) The percent of 8th graders who joined the math club is twice the percent of 7th graders who joined the math club.
(E) The percent of 6th graders who joined the chess club is the same as the percent of 8th graders who joined the drama club.
4.Which of the following is a true statement about stemplots?
(A) Stemplots are equally useful for small and for very large data sets.
(B) Stemplots are useful both for quantitative and for categorical data sets.
(C) Stemplots can show symmetry, gaps, clusters, and outliers.
(D) Stems should be skipped only if there is no data value for a particular stem.
(E) Whether or not to provide a key depends on the relative importance of the data.
5.Which of the following is incorrect?
(A) In histograms, frequencies can be determined from relative heights.
(B) In histograms, relative areas correspond to relative frequencies.
(C) Boxplots, dotplots, stemplots, and histograms can all show skewness.
(D) Sets with different distribution shapes can have identical boxplots.
(E) Both dotplots and stemplots can show symmetry, gaps, clusters, and outliers.
6.If three stations are selling gas for $2.10 per gallon, six are selling gas for $2.05 per gallon, and ten are selling gas for $2.00 per gallon, what is the median price per gallon among these stations?
(A) $2.00
(B) $2.025
(C) $2.0316
(D) $2.05
(E) $2.075
7.Suppose the average score of a national exam is 1,000 with a standard deviation of 200. If each score is increased by 50 and then each result is increased by 5 percent, what are the new mean and standard deviation?
(A) μ = 1,100 and σ = 200
(B) μ = 1,100 and σ = 210
(C) μ = 1,102.5 and σ = 200
(D) μ = 1,102.5 and σ = 210
(E) μ = 1,102.5 and σ = 212.5
8.For which of the following variables would it be most appropriate to construct a histogram?
(A) Television brand
(B) Insect species
(C) Gender
(D) Eye color
(E) Phone call length
9.If the standard deviation of a set of observations is 0, you can conclude
(A) that a mistake in arithmetic has been made
(B) that there is no relationship among the observations