Be prepared for exam day with Barron's. Trusted content from AP experts! Barron's AP Q&A Statistics features 600 questions with answer explanations designed to sharpen your critical thinking skills, provide practice for all AP question types, and maximize understanding of the concepts covered on the AP exam. Why Study with AP Q&A?
Each practice question follows the AP Statistics curriculum and includes Exploratory Analysis, Collecting and Producing Data, Probability, and Statistical Inference
All content is specifically created to provide practice for frequently tested topics on the AP Statistics exam
Answers include comprehensive explanations-- you won't just learn why an answer is correct, you'll learn why the other choices are incorrect
Check out Barron's AP Statistics Premium for even more review, full-length practice tests, and access to Barron's Online Learning Hub for a timed test option and automated scoring.
Häufig gestellte Fragen
Wie kann ich mein Abo kündigen?
Gehe einfach zum Kontobereich in den Einstellungen und klicke auf „Abo kündigen“ – ganz einfach. Nachdem du gekündigt hast, bleibt deine Mitgliedschaft für den verbleibenden Abozeitraum, den du bereits bezahlt hast, aktiv. Mehr Informationen hier.
(Wie) Kann ich Bücher herunterladen?
Derzeit stehen all unsere auf Mobilgeräte reagierenden ePub-Bücher zum Download über die App zur Verfügung. Die meisten unserer PDFs stehen ebenfalls zum Download bereit; wir arbeiten daran, auch die übrigen PDFs zum Download anzubieten, bei denen dies aktuell noch nicht möglich ist. Weitere Informationen hier.
Welcher Unterschied besteht bei den Preisen zwischen den Aboplänen?
Mit beiden Aboplänen erhältst du vollen Zugang zur Bibliothek und allen Funktionen von Perlego. Die einzigen Unterschiede bestehen im Preis und dem Abozeitraum: Mit dem Jahresabo sparst du auf 12 Monate gerechnet im Vergleich zum Monatsabo rund 30 %.
Was ist Perlego?
Wir sind ein Online-Abodienst für Lehrbücher, bei dem du für weniger als den Preis eines einzelnen Buches pro Monat Zugang zu einer ganzen Online-Bibliothek erhältst. Mit über 1 Million Büchern zu über 1.000 verschiedenen Themen haben wir bestimmt alles, was du brauchst! Weitere Informationen hier.
Unterstützt Perlego Text-zu-Sprache?
Achte auf das Symbol zum Vorlesen in deinem nächsten Buch, um zu sehen, ob du es dir auch anhören kannst. Bei diesem Tool wird dir Text laut vorgelesen, wobei der Text beim Vorlesen auch grafisch hervorgehoben wird. Du kannst das Vorlesen jederzeit anhalten, beschleunigen und verlangsamen. Weitere Informationen hier.
Ist AP Q&A Statistics:With 600 Questions and Answers als Online-PDF/ePub verfügbar?
Ja, du hast Zugang zu AP Q&A Statistics:With 600 Questions and Answers von Martin Sternstein im PDF- und/oder ePub-Format sowie zu anderen beliebten Büchern aus Study Aids & Advanced Placement. Aus unserem Katalog stehen dir über 1 Million Bücher zur Verfügung.
1.One element in the dotplot above is labeled X. Which of the statements below is true?
(A) X has the smallest z-score, in absolute value, of any element in the set.
(B) X has the largest z-score, in absolute value, of any element in the set.
(C) X has the smallest value of any element in the set.
(D) A boxplot will plot X as an isolated point.
(E) A back-to-back stemplot will show two symmetric clusters.
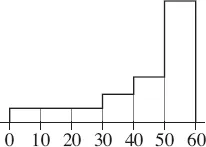
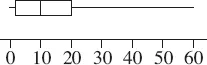
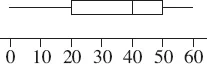
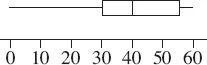
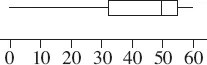
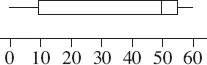
2.The histogram shown above might correspond to which of the boxplots below?
(A)
(B)
(C)
(D)
(E)
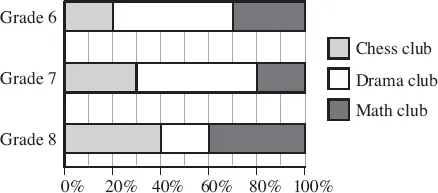
3.All students at a private middle school are required to sign up for one of the three clubs: chess, drama, or math. The graph below shows the distribution of participation by grade level.
Which of the following statements is incorrect?
(A) 30 percent of the 6th graders joined the math club.
(B) The number of 8th graders who joined the chess club is the same as the number of 8th graders who joined the math club.
(C) The number of 6th graders who joined the drama club is the same as the number of 7th graders who joined the drama club.
(D) The percent of 8th graders who joined the math club is twice the percent of 7th graders who joined the math club.
(E) The percent of 6th graders who joined the chess club is the same as the percent of 8th graders who joined the drama club.
4.Which of the following is a true statement about stemplots?
(A) Stemplots are equally useful for small and for very large data sets.
(B) Stemplots are useful both for quantitative and for categorical data sets.
(C) Stemplots can show symmetry, gaps, clusters, and outliers.
(D) Stems should be skipped only if there is no data value for a particular stem.
(E) Whether or not to provide a key depends on the relative importance of the data.
5.Which of the following is incorrect?
(A) In histograms, frequencies can be determined from relative heights.
(B) In histograms, relative areas correspond to relative frequencies.
(C) Boxplots, dotplots, stemplots, and histograms can all show skewness.
(D) Sets with different distribution shapes can have identical boxplots.
(E) Both dotplots and stemplots can show symmetry, gaps, clusters, and outliers.
6.If three stations are selling gas for $2.10 per gallon, six are selling gas for $2.05 per gallon, and ten are selling gas for $2.00 per gallon, what is the median price per gallon among these stations?
(A) $2.00
(B) $2.025
(C) $2.0316
(D) $2.05
(E) $2.075
7.Suppose the average score of a national exam is 1,000 with a standard deviation of 200. If each score is increased by 50 and then each result is increased by 5 percent, what are the new mean and standard deviation?
(A) μ = 1,100 and σ = 200
(B) μ = 1,100 and σ = 210
(C) μ = 1,102.5 and σ = 200
(D) μ = 1,102.5 and σ = 210
(E) μ = 1,102.5 and σ = 212.5
8.For which of the following variables would it be most appropriate to construct a histogram?
(A) Television brand
(B) Insect species
(C) Gender
(D) Eye color
(E) Phone call length
9.If the standard deviation of a set of observations is 0, you can conclude
(A) that a mistake in arithmetic has been made
(B) that there is no relationship among the observations