CHAPTER 1
HIERARCHICAL STRUCTURES: TREES
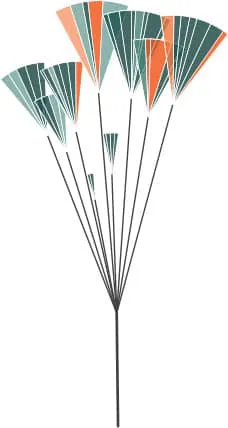
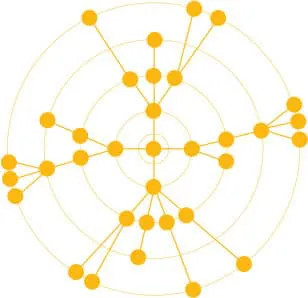
Stefanie Posavec and Greg McInerny, U.S.: “(En)tangled Word Bank,” 2009.
The series of diagrams represents changes in the six editions of Charles Darwin’s On the Origin of Species. Chapters are divided into subchapters, subchapters into paragraph “leaves,” and, finally, small wedge-shaped “leaflets” stand for sentences. Each sentence is colored in blue if it survives to the next edition, and in orange if it is deleted.
In a nutshell, hierarchical systems are ordered sets where elements and/or subsets are organized in a given relationship to one another, both among themselves and within the whole. Relationships vary according to the field domain and type of system, but, in general, we can describe them by the properties of elements and the laws that govern them (e.g., how they are shared and/or related).
In the seminal article “The Architecture of Complexity,” Herbert A. Simon contends that complexity often takes the form of hierarchy and, as such, hierarchy “is one of the central structural schemes that the architect of complexity uses.”1 Examples of hierarchical representations abound in the social and natural sciences throughout time up to today. According to Chen, “Visualizing hierarchies is one of the most mature and active branches in information visualization.”2
REPRESENTATION
Looking at hierarchical structures over time, it becomes apparent that ordered datasets are represented visually in two basic graphical forms, which sometimes are also combined: stacked and nested schemes.
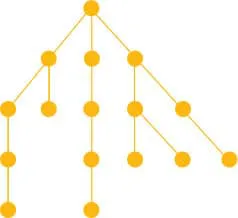
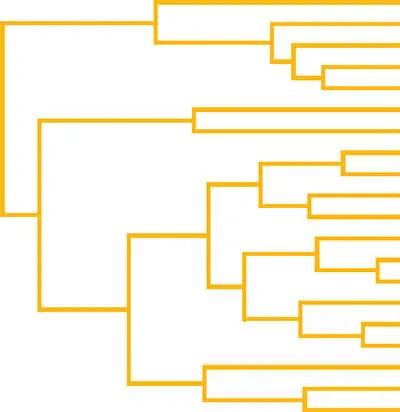
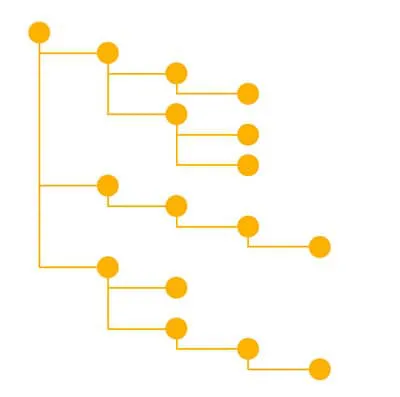
In stacked schemes, the elements are arranged in a directional relationship to one another: vertically, horizontally, or centrally (superior/inferior, center/periphery). In many instances, lines connect the elements in the set. Lines are one-dimensional visual elements described by their length and also provide directionality. Different geometries have been used to display stacked schemes, especially with recent computational models such as cone trees and hyperbolic views, for example.3
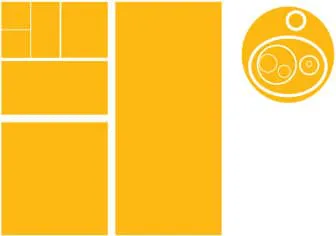
Elements in nested schemes are positioned within containers assembled according to their interdependency and subordination. The container, often a two-dimensional plane, provides the grouping and association of elements. Known examples are Venn diagrams and treemaps.4 The latter is examined in closer detail at the end of this chapter.
CARTESIAN SYSTEMS
node–link layout
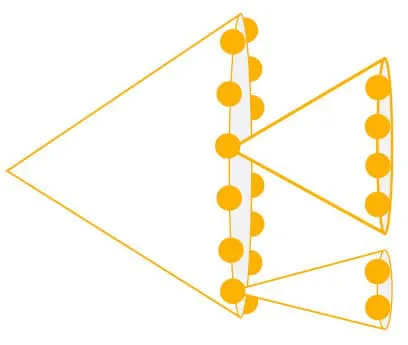
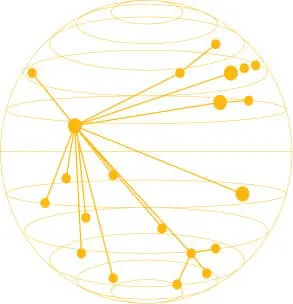
POLAR SYSTEMS
node–link radial layout
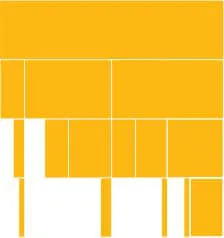
radial icicle or sunburst
OTHER GEOMETRIES
3D hyperbolic tree
The table provides a summary of hierarchical structures used in diverse fields over time. With the increasing accessibility of data in the digital age, and the need to represent trees with huge amounts of leaves, methods are constantly being devised to solve readability issues of hierarchical representations in the constrained spatial computer screens. Most methods use interactivity to enhance navigating between macro and micro scales of trees with large depth and breadth. For example, degree of interest trees use “focus + context” strategies to interactively navigate large trees by allowing filtering of nodes to display or collapse, as well as semantic zooming. These and other approaches for navigating large trees with text are investigated in chapter 6, Textual Structures.
VISUAL HIERARCHIES
It might sound like a tautology, but to effectively visualize hierarchical systems we need a well-defined hierarchical visual encoding system. In the art and design fields, we refer to hierarchy of visual elements mostly in relation to emphasis and attention, for example, as a means to help the eyes follow a certain direction or purpose. It is common to find the term contrast rather than hierarchy in art and design literature. Dondis in his seminal A Primer of Visual Literacy considers contrast as the prime visual technique: “In the process of visual articulation, contrast is a vital force in creating a coherent whole. In all of art, contrast is a powerful tool of expression, the means for intensification of ...