Design for Information
eBook - ePub

Design for Information

An Introduction to the Histories, Theories, and Best Practices Behind Effective Information Visualizations

Isabel Meirelles

Buch teilen
  1. 224 Seiten
  2. English
  3. ePUB (handyfreundlich)
  4. Über iOS und Android verfügbar
eBook - ePub

Design for Information

An Introduction to the Histories, Theories, and Best Practices Behind Effective Information Visualizations

Isabel Meirelles

Angaben zum Buch
Buchvorschau
Inhaltsverzeichnis
Quellenangaben

Über dieses Buch

The visualization process doesn't happen in a vacuum; it is grounded in principles and methodologies of design, cognition, perception, and human-computer-interaction that are combined to one's personal knowledge and creative experiences. Design for Information critically examines other design solutions —current and historic— helping you gain a larger understanding of how to solve specific problems. This book is designed to help you foster the development of a repertoire of existing methods and concepts to help you overcome design problems. Learn the ins and outs of data visualization with this informative book that provides you with a series of current visualization case studies. The visualizations discussed are analyzed for their design principles and methods, giving you valuable critical and analytical tools to further develop your design process. The case study format of this book is perfect for discussing the histories, theories and best practices in the field through real-world, effective visualizations. The selection represents a fraction of effective visualizations that we encounter in this burgeoning field, allowing you the opportunity to extend your study to other solutions in your specific field(s) of practice. This book is also helpful to students in other disciplines who are involved with visualizing information, such as those in the digital humanities and most of the sciences.

Häufig gestellte Fragen

Wie kann ich mein Abo kündigen?
Gehe einfach zum Kontobereich in den Einstellungen und klicke auf „Abo kündigen“ – ganz einfach. Nachdem du gekündigt hast, bleibt deine Mitgliedschaft für den verbleibenden Abozeitraum, den du bereits bezahlt hast, aktiv. Mehr Informationen hier.
(Wie) Kann ich Bücher herunterladen?
Derzeit stehen all unsere auf Mobilgeräte reagierenden ePub-Bücher zum Download über die App zur Verfügung. Die meisten unserer PDFs stehen ebenfalls zum Download bereit; wir arbeiten daran, auch die übrigen PDFs zum Download anzubieten, bei denen dies aktuell noch nicht möglich ist. Weitere Informationen hier.
Welcher Unterschied besteht bei den Preisen zwischen den Aboplänen?
Mit beiden Aboplänen erhältst du vollen Zugang zur Bibliothek und allen Funktionen von Perlego. Die einzigen Unterschiede bestehen im Preis und dem Abozeitraum: Mit dem Jahresabo sparst du auf 12 Monate gerechnet im Vergleich zum Monatsabo rund 30 %.
Was ist Perlego?
Wir sind ein Online-Abodienst für Lehrbücher, bei dem du für weniger als den Preis eines einzelnen Buches pro Monat Zugang zu einer ganzen Online-Bibliothek erhältst. Mit über 1 Million Büchern zu über 1.000 verschiedenen Themen haben wir bestimmt alles, was du brauchst! Weitere Informationen hier.
Unterstützt Perlego Text-zu-Sprache?
Achte auf das Symbol zum Vorlesen in deinem nächsten Buch, um zu sehen, ob du es dir auch anhören kannst. Bei diesem Tool wird dir Text laut vorgelesen, wobei der Text beim Vorlesen auch grafisch hervorgehoben wird. Du kannst das Vorlesen jederzeit anhalten, beschleunigen und verlangsamen. Weitere Informationen hier.
Ist Design for Information als Online-PDF/ePub verfügbar?
Ja, du hast Zugang zu Design for Information von Isabel Meirelles im PDF- und/oder ePub-Format sowie zu anderen beliebten Büchern aus Design & Graphic Design. Aus unserem Katalog stehen dir über 1 Million Bücher zur Verfügung.

Information

Jahr
2013
ISBN
9781610589482

CHAPTER 1

HIERARCHICAL STRUCTURES: TREES

Image
Stefanie Posavec and Greg McInerny, U.S.: “(En)tangled Word Bank,” 2009.
The series of diagrams represents changes in the six editions of Charles Darwin’s On the Origin of Species. Chapters are divided into subchapters, subchapters into paragraph “leaves,” and, finally, small wedge-shaped “leaflets” stand for sentences. Each sentence is colored in blue if it survives to the next edition, and in orange if it is deleted.
In a nutshell, hierarchical systems are ordered sets where elements and/or subsets are organized in a given relationship to one another, both among themselves and within the whole. Relationships vary according to the field domain and type of system, but, in general, we can describe them by the properties of elements and the laws that govern them (e.g., how they are shared and/or related).
In the seminal article “The Architecture of Complexity,” Herbert A. Simon contends that complexity often takes the form of hierarchy and, as such, hierarchy “is one of the central structural schemes that the architect of complexity uses.”1 Examples of hierarchical representations abound in the social and natural sciences throughout time up to today. According to Chen, “Visualizing hierarchies is one of the most mature and active branches in information visualization.”2
Image
Image

REPRESENTATION

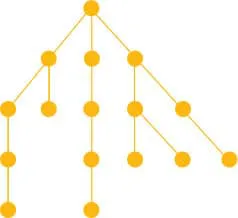
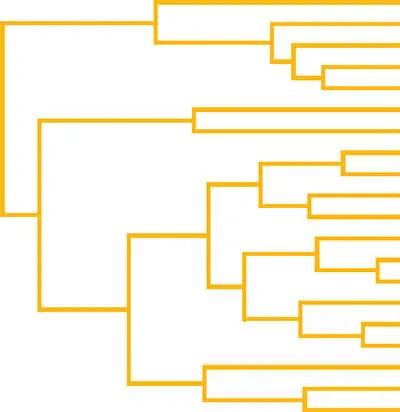
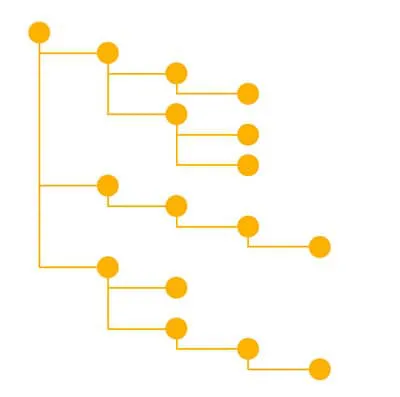
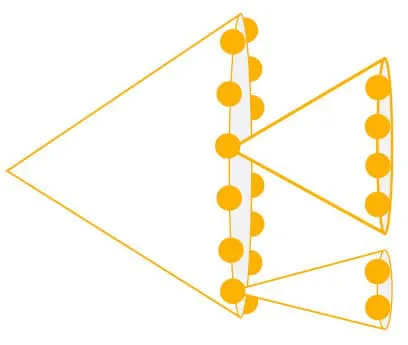
Looking at hierarchical structures over time, it becomes apparent that ordered datasets are represented visually in two basic graphical forms, which sometimes are also combined: stacked and nested schemes.
In stacked schemes, the elements are arranged in a directional relationship to one another: vertically, horizontally, or centrally (superior/inferior, center/periphery). In many instances, lines connect the elements in the set. Lines are one-dimensional visual elements described by their length and also provide directionality. Different geometries have been used to display stacked schemes, especially with recent computational models such as cone trees and hyperbolic views, for example.3
Elements in nested schemes are positioned within containers assembled according to their interdependency and subordination. The container, often a two-dimensional plane, provides the grouping and association of elements. Known examples are Venn diagrams and treemaps.4 The latter is examined in closer detail at the end of this chapter.
CARTESIAN SYSTEMS
Image
node–link layout
Image
dendogram
Image
indented layout
Image
cone-tree
Image
icicle tree
Image
treemap
POLAR SYSTEMS
Image
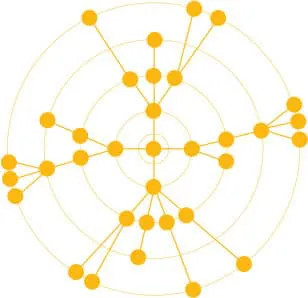
node–link radial layout
Image
radial icicle or sunburst
OTHER GEOMETRIES
Image
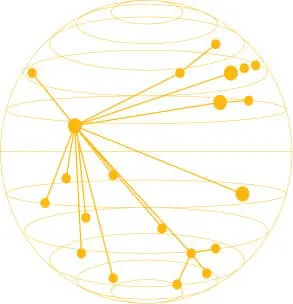
3D hyperbolic tree
Image
vonoroi treemap
The table provides a summary of hierarchical structures used in diverse fields over time. With the increasing accessibility of data in the digital age, and the need to represent trees with huge amounts of leaves, methods are constantly being devised to solve readability issues of hierarchical representations in the constrained spatial computer screens. Most methods use interactivity to enhance navigating between macro and micro scales of trees with large depth and breadth. For example, degree of interest trees use “focus + context” strategies to interactively navigate large trees by allowing filtering of nodes to display or collapse, as well as semantic zooming. These and other approaches for navigating large trees with text are investigated in chapter 6, Textual Structures.

VISUAL HIERARCHIES

It might sound like a tautology, but to effectively visualize hierarchical systems we need a well-defined hierarchical visual encoding system. In the art and design fields, we refer to hierarchy of visual elements mostly in relation to emphasis and attention, for example, as a means to help the eyes follow a certain direction or purpose. It is common to find the term contrast rather than hierarchy in art and design literature. Dondis in his seminal A Primer of Visual Literacy considers contrast as the prime visual technique: “In the process of visual articulation, contrast is a vital force in creating a coherent whole. In all of art, contrast is a powerful tool of expression, the means for intensification of ...

Inhaltsverzeichnis