Financial Valuation and Econometrics
eBook - ePub

Financial Valuation and Econometrics

Kian Guan Lim

Compartir libro
  1. 604 páginas
  2. English
  3. ePUB (apto para móviles)
  4. Disponible en iOS y Android
eBook - ePub

Financial Valuation and Econometrics

Kian Guan Lim

Detalles del libro
Vista previa del libro
Índice
Citas

Información del libro

This book is an introduction to financial valuation and financial data analyses using econometric methods. It is intended for advanced finance undergraduates and graduates. Most chapters in the book would contain one or more finance application examples where finance concepts, and sometimes theory, are taught.

This book is a modest attempt to bring together several important domains in financial valuation theory, in econometrics modelling, and in the empirical analyses of financial data. These domains are highly intertwined and should be properly understood in order to correctly and effectively harness the power of data and statistical or econometrics methods for investment and financial decision-making.

The contribution in this book, and at the same time, its novelty, is in employing materials in basic econometrics, particularly linear regression analyses, and weaving into it threads of foundational finance theory, concepts, ideas, and models. It provides a clear pedagogical approach to allow very effective learning by a finance student who wants to be well equipped in both theory and ability to research the data.

This is a handy book for finance professionals doing research to easily access the key techniques in data analyses using regression methods. Students learn all 3 skills at once — finance, econometrics, and data analyses. It provides for very solid and useful learning for advanced undergraduate and graduate students who wish to work in financial analyses, risk analyses, and financial research areas.

Request Inspection Copy


Contents:

  • Probability Distribution and Statistics
  • Statistical Laws and Central Limit Theorem / Application: Stock Return Distributions
  • Two-Variable Linear Regression/Application: Financial Hedging
  • Model Estimation / Application: Capital Asset Pricing Model
  • Constrained Regression / Application: Cost of Capital
  • Time Series Analysis / Application: Inflation Forecasting
  • Random Walk / Application: Market Efficiency
  • Autoregression and Persistence / Application: Predictability
  • Estimation Errors and T -Tests / Application: Event Studies
  • Multiple Linear Regression and Stochastic Regressors
  • Dummy Variables and ANOVA / Application: Time Effect Anomalies
  • Specification Errors
  • Cross-Sectional Regression / Application: Testing CAPM
  • More Multiple Linear Regressions / Application: Multi-Factor Asset Pricing
  • Errors-in-Variable / Application: Exchange Rates and Risk Premium
  • Unit Root Processes / Application: Purchasing Power Parity
  • Conditional Heteroskedasticity / Application: Risk Estimation
  • Maximum Likelihood and Goodness of Fit / Application: Choice of Copulas
  • Mean Reverting Continuous Time Process / Application: Bonds and Term Structures
  • Implied Parameters / Application: Option Pricing
  • Generalised Method of Moments / Application: Consumption-Based Asset Pricing
  • Multiple Time Series Regression / Application: Term Structure of Volatilities
  • Fixed and Random Effects Model / Application: Synchronicity of Stock Returns
  • LOGIT and PROBIT Regressions / Application: Categorization and Prediction


Readership: Advanced undergraduates and 1st year post-graduate students in finance and econometrics.
Key Features:

  • The book is a handy one for finance professionals doing research to easily access the key techniques in data analyses using regression methods
  • Students learn all 3 skills at once — finance, econometrics, and data analyses
  • It provides for very solid and useful learning for advanced undergraduate and graduate students who wish to work in financial analyses, risk analyses, and financial research areas

Preguntas frecuentes

¿Cómo cancelo mi suscripción?
Simplemente, dirígete a la sección ajustes de la cuenta y haz clic en «Cancelar suscripción». Así de sencillo. Después de cancelar tu suscripción, esta permanecerá activa el tiempo restante que hayas pagado. Obtén más información aquí.
¿Cómo descargo los libros?
Por el momento, todos nuestros libros ePub adaptables a dispositivos móviles se pueden descargar a través de la aplicación. La mayor parte de nuestros PDF también se puede descargar y ya estamos trabajando para que el resto también sea descargable. Obtén más información aquí.
¿En qué se diferencian los planes de precios?
Ambos planes te permiten acceder por completo a la biblioteca y a todas las funciones de Perlego. Las únicas diferencias son el precio y el período de suscripción: con el plan anual ahorrarás en torno a un 30 % en comparación con 12 meses de un plan mensual.
¿Qué es Perlego?
Somos un servicio de suscripción de libros de texto en línea que te permite acceder a toda una biblioteca en línea por menos de lo que cuesta un libro al mes. Con más de un millón de libros sobre más de 1000 categorías, ¡tenemos todo lo que necesitas! Obtén más información aquí.
¿Perlego ofrece la función de texto a voz?
Busca el símbolo de lectura en voz alta en tu próximo libro para ver si puedes escucharlo. La herramienta de lectura en voz alta lee el texto en voz alta por ti, resaltando el texto a medida que se lee. Puedes pausarla, acelerarla y ralentizarla. Obtén más información aquí.
¿Es Financial Valuation and Econometrics un PDF/ePUB en línea?
Sí, puedes acceder a Financial Valuation and Econometrics de Kian Guan Lim en formato PDF o ePUB, así como a otros libros populares de Betriebswirtschaft y Finanzwesen. Tenemos más de un millón de libros disponibles en nuestro catálogo para que explores.

Información

Editorial
WSPC
Año
2015
ISBN
9789814644037
Edición
2
Categoría
Finanzwesen

Chapter 1

PROBABILITY DISTRIBUTION AND STATISTICS

Key Points of Learning
Random variable, Joint probability distribution, Marginal probability distribution, Conditional probability distribution, Expected value, Variance, Covariance, Correlation, Independence, Normal distribution function, Chi-square distribution, Student-t distribution, F-distribution, Data types and categories, Sampling distribution, Hypothesis, Statistical test

1.1PROBABILITY

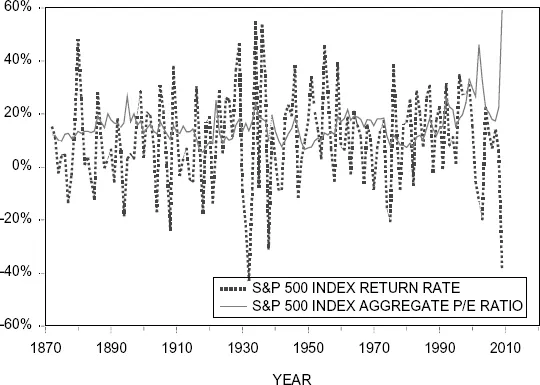
Joint probability, marginal probability, and conditional probability are important basic tools in financial valuation and regression analyses. These concepts and their usefulness in financial data analyses will become clearer at the end of the chapter. To motivate the idea of a joint probability distribution, let us begin by looking at a time series plot or graph of two financial economic variables over time: Xt and Yt, for example, S&P 500 Index aggregate price-to-earnings ratio Xt, and S&P 500 Index return rate Yt. The values or numbers that variables Xt and Yt will take are uncertain before they happen, i.e. before time t. At time t, both economic variables take realised values or numbers xt and yt. xt and yt are said to be realised jointly or simultaneously at the same time t. Thus, we can describe their values as a joint pair (xt, yt). If their order is preserved, it is called an ordered pair. Note that the subscript t represents the time index.
The P/E or price-to-earnings ratio of a stock or a portfolio is a financial ratio showing the price paid for the stock relative to the annual net income or profit per share earned by the firm for the year. The reciprocal of the P/E ratio is called the earnings yield. The earnings yield or E/P reflects the risky annual accounting rate of return, R, on the stock. This is easily shown by the relationship $E = $P × R. In other words, P/E = 1/R.
In Fig. 1.1, it seems that low return corresponded to, or lagged high P/E especially at the beginnings of the years 1929–1930, 1999–2002, and 2008–2009. Conversely, high returns followed relatively low P/E ratios at the beginnings of the years 1949–1954, 1975–1982, and 2006–2007. We shall explore the issue of the predictability of stock return in more details in Chap. 8.
The idea that random variables correspond with each other over time or that display some form of association is called a statistical correlation which is defined, or which has interpretative meaning, only when there is the existence of a joint probability distribution describing the random variables.
figure
Figure 1.1. S&P 500 Index Portfolio Return Rate and Price-Earning Ratio 1872–2009 (Data from Prof Shiller, Yale University).
In Fig. 1.2, we plot the U.S. national aggregate consumption versus national disposable income in US$ billion. Disposable income is defined as Personal Income less personal taxes. Personal Income is National Income less corporate taxes and corporate-retained earnings. In turn, National Income is Gross Domestic Product (GDP) less depreciation and indirect business taxes such as sales tax. GDP is essentially the total dollar output or gross income of the country. If we include repatriations from citizens working abroad, then it becomes Gross National Product (GNP).
In Fig. 1.2, it appears that consumption increases in disposable income. The relationship is approximately linear. This is intuitive as on a per capita basis, we would expect that for each person, when his or her disposable income rises, he or she would consume more. In life-cycle models of financial economics theory, some types of individual preferences could lead to consumpt...

Índice