
eBook - ePub
Medical Statistics at a Glance
Aviva Petrie, Caroline Sabin
This is a test
Compartir libro
- English
- ePUB (apto para móviles)
- Disponible en iOS y Android
eBook - ePub
Medical Statistics at a Glance
Aviva Petrie, Caroline Sabin
Detalles del libro
Vista previa del libro
Índice
Citas
Información del libro
Now in its fourth edition, Medical Statistics at a Glance is a concise and accessible introduction to this complex subject. It provides clear instruction on how to apply commonly used statistical procedures in an easy-to-read, comprehensive and relevant volume. This new edition continues to be the ideal introductory manual and reference guide to medical statistics, an invaluable companion for statistics lectures and a very useful revision aid.
This new edition of Medical Statistics at a Glance:
- Offers guidance on the practical application of statistical methods in conducting research and presenting results
- Explains the underlying concepts of medical statistics and presents the key facts without being unduly mathematical
- Contains succinct self-contained chapters, each with one or more examples, many of them new, to illustrate the use of the methodology described in the chapter.
- Now provides templates for critical appraisal, checklists for the reporting of randomized controlled trials and observational studies and references to the EQUATOR guidelines for the presentation of study results for many other types of study
- Includes extensive cross-referencing, flowcharts to aid the choice of appropriate tests, learning objectives for each chapter, a glossary of terms and a glossary of annotated full computer output relevant to the examples in the text
- Provides cross-referencing to the multiple choice and structured questions in the companion Medical Statistics at a Glance Workbook
Medical Statistics at a Glance is a must-have text for undergraduate and post-graduate medical students, medical researchers and biomedical and pharmaceutical professionals.
Preguntas frecuentes
¿Cómo cancelo mi suscripción?
¿Cómo descargo los libros?
Por el momento, todos nuestros libros ePub adaptables a dispositivos móviles se pueden descargar a través de la aplicación. La mayor parte de nuestros PDF también se puede descargar y ya estamos trabajando para que el resto también sea descargable. Obtén más información aquí.
¿En qué se diferencian los planes de precios?
Ambos planes te permiten acceder por completo a la biblioteca y a todas las funciones de Perlego. Las únicas diferencias son el precio y el período de suscripción: con el plan anual ahorrarás en torno a un 30 % en comparación con 12 meses de un plan mensual.
¿Qué es Perlego?
Somos un servicio de suscripción de libros de texto en línea que te permite acceder a toda una biblioteca en línea por menos de lo que cuesta un libro al mes. Con más de un millón de libros sobre más de 1000 categorías, ¡tenemos todo lo que necesitas! Obtén más información aquí.
¿Perlego ofrece la función de texto a voz?
Busca el símbolo de lectura en voz alta en tu próximo libro para ver si puedes escucharlo. La herramienta de lectura en voz alta lee el texto en voz alta por ti, resaltando el texto a medida que se lee. Puedes pausarla, acelerarla y ralentizarla. Obtén más información aquí.
¿Es Medical Statistics at a Glance un PDF/ePUB en línea?
Sí, puedes acceder a Medical Statistics at a Glance de Aviva Petrie, Caroline Sabin en formato PDF o ePUB, así como a otros libros populares de Medicina y Bioestadística. Tenemos más de un millón de libros disponibles en nuestro catálogo para que explores.
Información
Part 1
Handling data
Chapters
- 1 Types of data
- 2 Data entry
- 3 Error checking and outliers
- 4 Displaying data diagrammatically
- 5 Describing data: the ‘average’
- 6 Describing data: the ‘spread’
- 7 Theoretical distributions: the Normal distribution
- 8 Theoretical distributions: other distributions
- 9 Transformations
1
Types of data
| Learning objectives |
| By the end of this chapter, you should be able to:
Relevant Workbook questions: MCQs 1, 2 and 16; and SQ 1 available online |
Data and statistics
The purpose of most studies is to collect data to obtain information about a particular area of research. Our data comprise observations on one or more variables; any quantity that varies is termed a variable. For example, we may collect basic clinical and demographic information on patients with a particular illness. The variables of interest may include the sex, age and height of the patients.
Our data are usually obtained from a sample of individuals that represents the population of interest. Our aim is to condense these data in a meaningful way and extract useful information from them. Statistics encompasses the methods of collecting, summarizing, analysing and drawing conclusions from the data: we use statistical techniques to achieve our aim.
Data may take many different forms. We need to know what form every variable takes before we can make a decision regarding the most appropriate statistical methods to use. Each variable and the resulting data will be one of two types: categorical or numerical (Fig. 1.1).
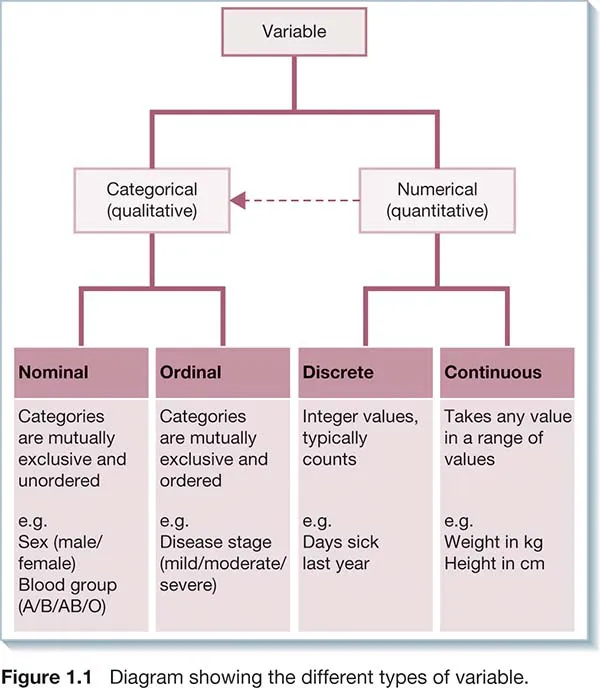
Categorical (qualitative) data
These occur when each individual can only belong to one of a number of distinct categories of the variable.
- Nominal data – the categories are not ordered but simply have names. Examples include blood group (A, B, AB and O) and marital status (married/widowed/single, etc.). In this case, there is no reason to suspect that being married is any better (or worse) than being single!
- Ordinal data – the categories are ordered in some way. Examples include disease staging systems (advanced, moderate, mild, none) and degree of pain (severe, moderate, mild, none).
A categorical variable is binary or dichotomous when there are only two possible categories. Examples include ‘Yes/No’, ‘Dead/Alive’ or ‘Patient has disease/Patient does not have disease’.
Numerical (quantitative) data
These occur when the variable takes some numerical value. We can subdivide numerical data into two types.
- Discrete data – occur when the variable can only take certain whole numerical values. These are often counts of numbers of events, such as the number of visits to a GP in a particular year or the number of episodes of illness in an individual over the last 5 years.
- Continuous data – occur when there is no limitation on the values that the variable can take, e.g. weight or height, other than that which restricts us when we make the measurement.
Distinguishing between data types
We often use very different statistical methods depending on whether the data are categorical or numerical. Although the distinction between categorical and numerical data is usually clear, in some situations it may become blurred. For example, when we have a variable with a large number of ordered categories (e.g. a pain scale with seven categories), it may be difficult to distinguish it from a discrete numerical variable. The distinction between discrete and continuous numerical data may be even less clear, although in general this will have little impact on the results of most analyses. Age is an example of a variable that is often treated as...