
eBook - ePub
Medical Statistics at a Glance
Aviva Petrie, Caroline Sabin
This is a test
Buch teilen
- English
- ePUB (handyfreundlich)
- Über iOS und Android verfügbar
eBook - ePub
Medical Statistics at a Glance
Aviva Petrie, Caroline Sabin
Angaben zum Buch
Buchvorschau
Inhaltsverzeichnis
Quellenangaben
Über dieses Buch
Now in its fourth edition, Medical Statistics at a Glance is a concise and accessible introduction to this complex subject. It provides clear instruction on how to apply commonly used statistical procedures in an easy-to-read, comprehensive and relevant volume. This new edition continues to be the ideal introductory manual and reference guide to medical statistics, an invaluable companion for statistics lectures and a very useful revision aid.
This new edition of Medical Statistics at a Glance:
- Offers guidance on the practical application of statistical methods in conducting research and presenting results
- Explains the underlying concepts of medical statistics and presents the key facts without being unduly mathematical
- Contains succinct self-contained chapters, each with one or more examples, many of them new, to illustrate the use of the methodology described in the chapter.
- Now provides templates for critical appraisal, checklists for the reporting of randomized controlled trials and observational studies and references to the EQUATOR guidelines for the presentation of study results for many other types of study
- Includes extensive cross-referencing, flowcharts to aid the choice of appropriate tests, learning objectives for each chapter, a glossary of terms and a glossary of annotated full computer output relevant to the examples in the text
- Provides cross-referencing to the multiple choice and structured questions in the companion Medical Statistics at a Glance Workbook
Medical Statistics at a Glance is a must-have text for undergraduate and post-graduate medical students, medical researchers and biomedical and pharmaceutical professionals.
Häufig gestellte Fragen
Wie kann ich mein Abo kündigen?
Gehe einfach zum Kontobereich in den Einstellungen und klicke auf „Abo kündigen“ – ganz einfach. Nachdem du gekündigt hast, bleibt deine Mitgliedschaft für den verbleibenden Abozeitraum, den du bereits bezahlt hast, aktiv. Mehr Informationen hier.
(Wie) Kann ich Bücher herunterladen?
Derzeit stehen all unsere auf Mobilgeräte reagierenden ePub-Bücher zum Download über die App zur Verfügung. Die meisten unserer PDFs stehen ebenfalls zum Download bereit; wir arbeiten daran, auch die übrigen PDFs zum Download anzubieten, bei denen dies aktuell noch nicht möglich ist. Weitere Informationen hier.
Welcher Unterschied besteht bei den Preisen zwischen den Aboplänen?
Mit beiden Aboplänen erhältst du vollen Zugang zur Bibliothek und allen Funktionen von Perlego. Die einzigen Unterschiede bestehen im Preis und dem Abozeitraum: Mit dem Jahresabo sparst du auf 12 Monate gerechnet im Vergleich zum Monatsabo rund 30 %.
Was ist Perlego?
Wir sind ein Online-Abodienst für Lehrbücher, bei dem du für weniger als den Preis eines einzelnen Buches pro Monat Zugang zu einer ganzen Online-Bibliothek erhältst. Mit über 1 Million Büchern zu über 1.000 verschiedenen Themen haben wir bestimmt alles, was du brauchst! Weitere Informationen hier.
Unterstützt Perlego Text-zu-Sprache?
Achte auf das Symbol zum Vorlesen in deinem nächsten Buch, um zu sehen, ob du es dir auch anhören kannst. Bei diesem Tool wird dir Text laut vorgelesen, wobei der Text beim Vorlesen auch grafisch hervorgehoben wird. Du kannst das Vorlesen jederzeit anhalten, beschleunigen und verlangsamen. Weitere Informationen hier.
Ist Medical Statistics at a Glance als Online-PDF/ePub verfügbar?
Ja, du hast Zugang zu Medical Statistics at a Glance von Aviva Petrie, Caroline Sabin im PDF- und/oder ePub-Format sowie zu anderen beliebten Büchern aus Medicine & Biostatistics. Aus unserem Katalog stehen dir über 1 Million Bücher zur Verfügung.
Information
Part 1
Handling data
Chapters
- 1 Types of data
- 2 Data entry
- 3 Error checking and outliers
- 4 Displaying data diagrammatically
- 5 Describing data: the ‘average’
- 6 Describing data: the ‘spread’
- 7 Theoretical distributions: the Normal distribution
- 8 Theoretical distributions: other distributions
- 9 Transformations
1
Types of data
| Learning objectives |
| By the end of this chapter, you should be able to:
Relevant Workbook questions: MCQs 1, 2 and 16; and SQ 1 available online |
Data and statistics
The purpose of most studies is to collect data to obtain information about a particular area of research. Our data comprise observations on one or more variables; any quantity that varies is termed a variable. For example, we may collect basic clinical and demographic information on patients with a particular illness. The variables of interest may include the sex, age and height of the patients.
Our data are usually obtained from a sample of individuals that represents the population of interest. Our aim is to condense these data in a meaningful way and extract useful information from them. Statistics encompasses the methods of collecting, summarizing, analysing and drawing conclusions from the data: we use statistical techniques to achieve our aim.
Data may take many different forms. We need to know what form every variable takes before we can make a decision regarding the most appropriate statistical methods to use. Each variable and the resulting data will be one of two types: categorical or numerical (Fig. 1.1).
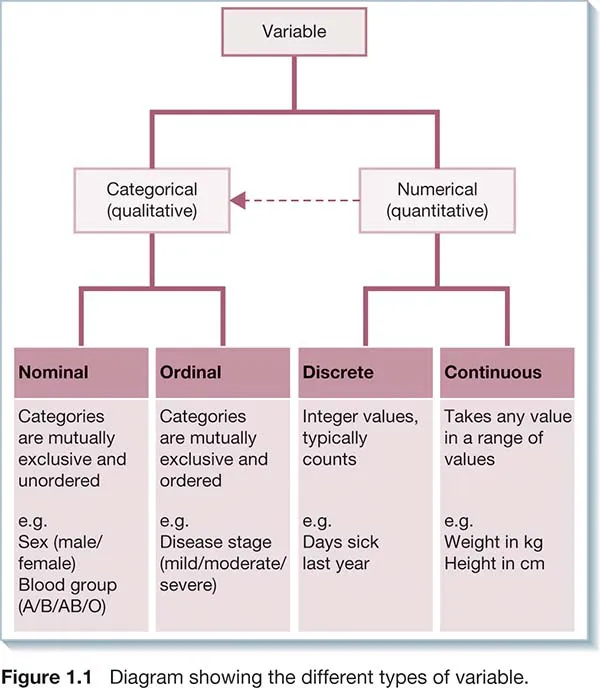
Categorical (qualitative) data
These occur when each individual can only belong to one of a number of distinct categories of the variable.
- Nominal data – the categories are not ordered but simply have names. Examples include blood group (A, B, AB and O) and marital status (married/widowed/single, etc.). In this case, there is no reason to suspect that being married is any better (or worse) than being single!
- Ordinal data – the categories are ordered in some way. Examples include disease staging systems (advanced, moderate, mild, none) and degree of pain (severe, moderate, mild, none).
A categorical variable is binary or dichotomous when there are only two possible categories. Examples include ‘Yes/No’, ‘Dead/Alive’ or ‘Patient has disease/Patient does not have disease’.
Numerical (quantitative) data
These occur when the variable takes some numerical value. We can subdivide numerical data into two types.
- Discrete data – occur when the variable can only take certain whole numerical values. These are often counts of numbers of events, such as the number of visits to a GP in a particular year or the number of episodes of illness in an individual over the last 5 years.
- Continuous data – occur when there is no limitation on the values that the variable can take, e.g. weight or height, other than that which restricts us when we make the measurement.
Distinguishing between data types
We often use very different statistical methods depending on whether the data are categorical or numerical. Although the distinction between categorical and numerical data is usually clear, in some situations it may become blurred. For example, when we have a variable with a large number of ordered categories (e.g. a pain scale with seven categories), it may be difficult to distinguish it from a discrete numerical variable. The distinction between discrete and continuous numerical data may be even less clear, although in general this will have little impact on the results of most analyses. Age is an example of a variable that is often treated as...