A timely, accessible survey of the multidisciplinary field of bioanalytical chemistry
Provides an all in one approach for both beginners and experts, from a broad range of backgrounds, covering introductions, theory, advanced concepts and diverse applications for each method
Each chapter progresses from basic concepts to applications involving real samples
Includes three new chapters on Biomimetic Materials, Lab-on-Chip, and Analytical Methods
Contains end-of-chapter problems and an appendix with selected answers
Preguntas frecuentes
¿Cómo cancelo mi suscripción?
Simplemente, dirígete a la sección ajustes de la cuenta y haz clic en «Cancelar suscripción». Así de sencillo. Después de cancelar tu suscripción, esta permanecerá activa el tiempo restante que hayas pagado. Obtén más información aquí.
¿Cómo descargo los libros?
Por el momento, todos nuestros libros ePub adaptables a dispositivos móviles se pueden descargar a través de la aplicación. La mayor parte de nuestros PDF también se puede descargar y ya estamos trabajando para que el resto también sea descargable. Obtén más información aquí.
¿En qué se diferencian los planes de precios?
Ambos planes te permiten acceder por completo a la biblioteca y a todas las funciones de Perlego. Las únicas diferencias son el precio y el período de suscripción: con el plan anual ahorrarás en torno a un 30 % en comparación con 12 meses de un plan mensual.
¿Qué es Perlego?
Somos un servicio de suscripción de libros de texto en línea que te permite acceder a toda una biblioteca en línea por menos de lo que cuesta un libro al mes. Con más de un millón de libros sobre más de 1000 categorías, ¡tenemos todo lo que necesitas! Obtén más información aquí.
¿Perlego ofrece la función de texto a voz?
Busca el símbolo de lectura en voz alta en tu próximo libro para ver si puedes escucharlo. La herramienta de lectura en voz alta lee el texto en voz alta por ti, resaltando el texto a medida que se lee. Puedes pausarla, acelerarla y ralentizarla. Obtén más información aquí.
¿Es Bioanalytical Chemistry un PDF/ePUB en línea?
Sí, puedes acceder a Bioanalytical Chemistry de Susan R. Mikkelsen, Eduardo Cortón en formato PDF o ePUB, así como a otros libros populares de Biological Sciences y Biochemistry. Tenemos más de un millón de libros disponibles en nuestro catálogo para que explores.
This chapter introduces the basic principles underlying many common methods of signal transduction. This term is used to describe the conversion of one type of energy to another. Generally, analytical specialists use the term transducer to describe the conversion of a concentration (or mass) into a useful electronic signal, which is ultimately almost always a voltage. This voltage is related to the concentration (or mass) of the analyte, or species of interest, in the original sample. The species that can be measured by one or more of these methods is not always the analyte itself; for example, if the analyte is an enzyme or other catalytic species, the depletion of reactants or accumulation of products is assessed based on their own unique properties.
Transduction can be accomplished in many different ways, and the choice of the best method depends on which of many possible physical properties are exhibited by the measured species. In this chapter, we consider the three main types of transduction that are widely used in instrumental methods in bioanalytical chemistry. The conversion of light into current is performed by photodiodes or photomultipliers, and this current is then electronically converted into a voltage that is proportional to the intensity of the light. Electrochemical and surface plasmon resonance transducers convert chemical energy into a measured voltage or into a current that is subsequently converted to a voltage. Scintillation counters, used in many radiochemical methods, first convert beta-particle radioactivity to light, and the light is detected using photodiodes or photomultipliers. Thermal transducers, used for calorimetry, convert heat into current (and then voltage).
Considerations for the choice of a transduction method include the uniqueness of the various measurable properties of the measured species, since it is often present in a complicated sample matrix. The matrix is the surrounding environment, and includes all other components present in the sample. Matrix components can interfere with measurements in direct or indirect ways: a matrix component may exhibit a similar physical property to the analyte, and interfere with analyte measurement; also, a matrix component may interact with the analyte, changing the nature of its physical property and/or the magnitude of its resulting signal.
This chapter is intended as an introduction and brief review of common transduction methods used in bioanalytical chemistry. More detailed descriptions of applications and instrumental variations will be found within specific chapters of this book, where more specialized adaptations are described for specific assay methods.
The reader is referred to two excellent analytical chemistry textbooks for greater depth of coverage of most of the basic descriptions given in this chapter, as well as two excellent review articles for more information on thermal measurement methods, listed at the end of the chapter.
1.2 Optical Measurements
The majority of quantitative optical methods make use of light that is either absorbed or emitted in the ultraviolet and visible regions of the electromagnetic spectrum. These regions formally correspond to wavelengths of 1.0 × 10⁻⁸ to 7.8 × 10⁻⁷ m, and are more commonly expressed in nm units (10 to 780 nm). The far UV region, also called the vacuum UV region, is generally not analytically useful, but the near UV and the visible regions are widely used.
The colours that surround us result mainly from wavelength-selective visible light absorption by molecules present in the items that we see. However, differences between species, and between individuals within a species, cause the wavelength range of visible light, and the colours within this range, to be perceived differently. Common examples are bumblebees, that have blue-shifted visible ranges, and hummingbirds, that have red-shifted ranges. For this reason, standard wavelength ranges have been defined for the different colours of the visible spectrum. For example, blue light is defined as the 440–470 nm range, and if blue light is absorbed, its complementary colour, orange, is observed. Similarly, if green light (500–520 nm) is absorbed, purple is the observed colour. Many compounds absorb light at multiple wavelengths, and it is the combination of complementary colours that we observe.
The relationship between wavelength, frequency and energy of light is shown below:
(1.1)
where E is the energy of the light, h is Planck's constant (6.626 × 10⁻³⁴ J·s), υ is the frequency of the light (s−1), λ is the wavelength of the light (m), and c is the speed of light (2.998 × 10⁸ m/s in a vacuum, and this number is divided by the refractive index n for any other medium). This relationship connects the two key concepts that light is both a particle (a photon with energy E) and a wave, with frequency υ and wavelength λ.
In the visible and near UV regions of the spectrum, molecules absorb and emit light as their electronic configurations change. For example, electrons convert between paired and unpaired states, or between bonding and non-/antibonding orbitals. These conversions are accompanied by energy gains or losses as the molecule absorbs or emits a photon. Depending on molecular structure, as well as many other factors including solvent, pH and temperature, fixed electronic energy levels exist, and only photons of particular energies (wavelengths) can be absorbed or emitted. Associated with each electronic energy level are vibrational and rotational energy levels, which are separated by much smaller energy differences. Isolated vibrational or rotational transitions can be made to occur using infrared or microwave radiation, which have much lower energy. But the electronic transitions that occur in the UV-visible region are accompanied by vibrational and rotational transitions, and this means that a range of wavelengths can be absorbed by molecules, shown in Eq. 1.2:
(1.2)
where, for a given electronic transition, the total energy ΔET of the photons absorbed is the sum of the energy required for the electronic transition itself, ΔEElec, which is fixed, plus the energy changes associated with multiple possible vibrational and rotational transitions, ΔEVib and ΔERot. This means that, for any given electronic transition, molecules absorb or emit a fairly wide range of wavelengths, centered on a wavelength of maximal absorption or emission. For molecules absorbing or emitting light in the near UV and visible regions, the range of wavelengths can be as large as 100 nm for a given electronic transition, because of these accompanying vibrational and rotational transitions.
1.2.1 UV-Visible Absorbance
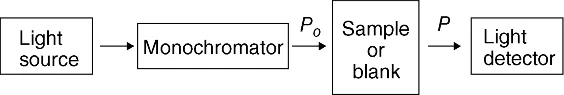
A simple spectrophotometer, an instrument for measuring absorbance, consists of a light source, a monochromator (or filter), a sample compartment and a light detector, all of which are enclosed to prevent interference from ambient light. These components are shown as a block diagram in Figure 1.1. Typically, the light source is a tungsten filament lamp (for the visible region) and/or a deuterium lamp (for the UV region); both of these sources emit continuous radiation over a wide range of wavelengths. Wavelength selection can be accomplished using filters, for repetitive fixed-wavelength measurements, or a monochromator containing a diffraction grating or prism, that allows adjustment of wavelength as well as wavelength scanning. The quality of the filter or monochromator determines the width of the wavelength range in the light beam that exits the device and is directed into the sample. Analyte solutions are contained in a cuvette (or cell) made of a material that is transparent to the wavelength(s) of interest, such as quartz, glass or polystyrene. Light detection may be accomplished using a photomultiplier tube, a photodiode, or a photodiode array (in which the spatial distribution of light of different wavelengths allows nearly instantaneous acquisition of a complete spectrum).
Figure 1.1 Block diagram of a simple UV-Vis absorption spectrophotometer.
Many variations of this simple design have been introduced for specialized applications. For example, dedicated instruments may employ an inexpensive light-emitting diode as the light source, a c...