![]()
Chapter 1
Subjective Doesn't Work in the Market
Technical Analysis Is the Objective Standard
Webster's Dictionary defines subjective as “characteristic of or belonging to reality as perceived rather than as independent of mind.” When we want an opinion from a critic on how good a movie is, we are expecting a subjective review. When we read a restaurant write up, we also get a subjective review. We may see the movie or eat the meal, and have a different experience than the critic did. We will tend to follow the critics who agree with our subjective notions.
This is fine for movies and dinner and many other things in life. But the market is not a matter of opinion. There are several ways in which “subjective” enters the marketplace. Subjectivity can enter when traders try to rely on the latest guru in the marketplace, when they try to use fundamental analysis in their decision making process, and when they use technical indicators on their charts. While there are some others, these are the three biggest culprits. I am going to explain how you can fall into each of these traps, and how you can avoid them.
THE GURU SYNDROME
The first common way in which people let subjectivity enter their trading comes to people before they decide to do it on their own. There is a tremendous tendency for people to want to follow a guru, or anyone who speaks with authority. Often these people are followed without any track record, simply because they say things that “make sense” or agree with our views in some way. Unfortunately, what appears to be common sense rarely works in the market place.
If you take a look at the famous gurus over the years that made a name for themselves, most of those names are gone. There may be new names today, but they will be gone tomorrow. People make names for themselves by standing up and taking a firm stand on the market. For example in the 1990s, you may remember (if you were following the market then) several big names who decided to take a very bullish stance once the market began moving up. As time went on they got fame for their “prediction” and continued to pound the table to be long. When the market turned in 2001, it also turned on them. They dropped off the map or were even heckled for their views. Very few gurus maintained a name for themselves when the market turned. Just like many did with their stocks, these gurus rode fame as the market rallied, and crashed with the market.
Did some predict the crash? Sure. The problem here is that many predicted the crash up to eight years earlier. Again, little fame is justified for such predictions. In every market you will find bulls and bears. Some are right, some are wrong. Those that are consistently right are harder to find. Those that are consistently right are often looked at as foolish for periods of time where they go against popular opinion, even though it is the right thing to do at the time. They have found their own method or style, and know how to use it properly. New people to the market usually find in short order that the “experts” on TV are not making them any money.
After a while, many learn it may be best to find a way to develop a system, method, or style of interpreting the market, or individual stocks, in order to find their own plays. For traders or investors of the market who decide to do the work themselves, there are still two ways in which subjectivity is introduced to their studies. The first way is by relying on fundamental rather than technical analysis. While this debate has continued since the beginning of time, my view is unquestionably that there is no debate: technical analysis is what works in the marketplace.
However, even when traders take the technical route subjective issues can still creep in through the use of technical indicators. Following is a discussion of both of these issues that new self-directed traders may face.
THE PITFALLS OF FUNDAMENTAL ANALYSIS
Going back to the first time anyone charted the price of something that was sold in an open market, the debate between fundamental and technical analysis has existed. Fundamentalists claim that technicians are trying to look at the past and predict the future. Technicians claim that fundamentalists are trying to find the value of a company, which is impossible to do, and that is not relevant even if you determine what it is.
Fundamentalists look at the accounting numbers of the company. They look at things like price to earnings ratios (PE ratios), book value, and other accounting type numbers. They also look at things like the ability of current management, new products coming out, and recent acquisitions. They then take all this information, and come up with an exact price that the company should be worth. From that, they calculate the price per share, and if the number is higher than the current stock price, they consider it undervalued, and a buy.
On one hand, it sounds like looking at hard numbers may be very objective. But there are several problems with this. First, how do you know to trust the numbers you are looking at? Back when Enron was trading over one hundred dollars a share, it was considered a great fundamental value. The problem was, of course, that the numbers that were being looked at were all lies. They were made up by accountants and CEOs. Was that an isolated incident? Not in the least. WorldCom and many other companies have gone out of business or had huge price swings as the underlying accounting numbers were found to be a “tad bit off.”
Even if you are less skeptical, talk to an accountant of any business. There are huge ranges in acceptable accounting measures that are allowed. Some are just allowed, while some are in constant debate as to what is correct. So the officers of a company can have huge swings in their profit and loss statements, based on the decisions made on how to account for certain big numbers. Fundamentalists often look to a change in profits by even a penny as being a big deal, when the accounting choice may have changed the outcome by a dollar. It becomes quite silly at some point. So, using the fundamental numbers of a company is a very subjective way of valuing a company when you come right down to it.
Beyond that, there is a more basic problem with fundament analysis that makes it even more subjective. It assumes that someone knows the value of a company based on last year's or last quarter's numbers. But that picture is immediately clouded when an analyst says, “That was last year, you should see what they are likely to do this year.” So now they start talking about increasing the value of their “objective” analysis by a guess as to what may happen in the future. This is why hundreds of companies in the 1990s (and this still continues today) had soaring stock prices, with no earnings. Fundamentally, without earnings, there are really no numbers to work with to justify any price, let alone a higher value than the current price. Yet the promise of future earnings had stocks rise from one dollar to literally hundreds of dollars, based simply on the promise of great earnings someday. Does that sound like how you want to make your trading and investing decisions?
There is one more problem that puts an end to the conversation. It simply does not work. Many companies that show undervalued prices, and have low PE ratios are often undervalued for a reason. There is a tendency for the cheap to just get cheaper. They are rarely good buys. Likewise, companies, or their stocks, that seem overvalued, rarely come down when analysts say they should. They are overvalued for a reason. If you have ever tried investing using fundamental numbers, you have likely discovered these issues for yourself. Fundamental analysis is actually totally subjective, hiding under only a veil of objectivity.
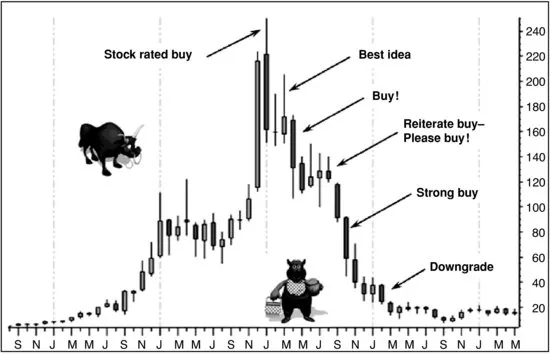
Most Wall Street analysts use fundamental analysis, though the number of technical analysts has increased dramatically. The opinions of Wall Street analysts on a particular stock or the overall market really have not been much help at all to investors and traders over the years. Take a look at Figure 1.1. Back in 2000 as the price of the stock was reaching all-time highs, everybody loved shares of Yahoo. Merrill Lynch had it as one of their best ideas. As the price declined they reiterated their buy recommendation believing it was such a great company the price of the stock had to rebound. The price continued to decline throughout the year as the Wall Street analysts continued to suggest investors snap up the shares. Finally when the stock had declined by about 90 percent, Merrill Lynch downgraded the stock and stopped urging investors to buy!
Technical analysis, on the other hand, looks to one thing: what the company, or price of the stock, is actually selling at. Technical analysis assumes that the price a stock is selling at is the perfect price based on the fact that all known quantities, whether in the past, or anticipated in the future, are built into the price. Tens, hundreds, thousands of investors and traders take positions on both sides of the stock price, and it trades at the price that they have determined based on supply and demand. It is the price. There can be no argument. When you think of it that way, any other method is useless.
Now, to determine the future price, technical analysis relies on patterns. Seeing prices that occur consistently in such a way it shows that there is ongoing demand for, or supply of, a stock. Learning these patterns is exactly what learning technical analysis is all about. Are their drawbacks? Of course, or else this debate would not exist. However, all drawbacks are a function of not understanding how to use technical analysis. For example, technical analysis finds patterns that are predictable, but it does not mean that every pattern you see will be a predictable pattern. Another example is the concept of multiple time frames. Smaller patterns exist inside bigger patterns, and if you do not know how they should interact, it can appear random. These concepts will be discussed more, later in this book. Most important for this chapter, regarding subjectivity, is the misuse of technical indicators. Many traders rely on technical indicators, but unfortunately these indicators take the objective chart and turn it subjective.
TECHNICAL INDICATORS: ADDING SUBJECTIVITY TO THE CHART
The term “technical indicator” refers to all the things on a chart other than price, which are derivatives of price. You may know some of them: Moving Average Convergence Divergence (MACD), Relative Strength Index (RSI), Stochastics, Gann Lines, Elliott Waves—the list goes on and on. There are charting programs that literally have over 200 of them. This alone should tell you the value of any one indicator. Even moving averages are technical indicators. While moving averages can have a useful purpose, they too are often used subjectively to a trader's detriment.
Technical indicators are subjective in nature for a couple of reasons. They all rely on past prices. Also, while they claim to add objectivity, they all have so many settings that it comes down to everyone's individual opinion of how to read them.
It Is All in the Past
As I just mentioned, all technical indicators rely on past prices and apply a mathematical formula, which is supposed to help predict the future move. The past prices are already on the chart in front of you. This is the objective part of the chart. Price is what matters. Once you create a derivative of that price, it is open to interpretation as to what it means.
Some who use indicators say that they remove the noise from the price movement. However, it's that noise that can provide some of the most valuable information to us. We'll get to this later on.
There is some subjectivity in reading a price pattern. Trading will always have some subjectivity. If it did not, the future of all prices would be known to all and there would not be a market. Our job as traders is to keep things as simple and objective as possible, to find the patterns we know. Indicators add just another layer of mystery, and rely on someone else's setting to tell us what is happening.
It Is Still a Matter of Opinion
Indicators rely almost entirely on opinion or how each individual reads the tea leaves of the various indicators. There have been literally hundreds of different oscillators and indicators developed over the years and when most of them have the option to change the settings it makes the choices endless. The simple truth is that they alone do not tell you anything about what is going on in a stock or in the markets. Investors and analysts over the years have developed countless methods to take the measure of the market. In reali...